Finance and Performance Committee
Agenda
Notice of Meeting Te Pānui o te Hui:
An ordinary meeting of the Finance &
Performance Committee will be held on:
Date: Wednesday 26 November 2025
Time: 9.30 am
Venue: Camellia Chambers, Civic Offices,
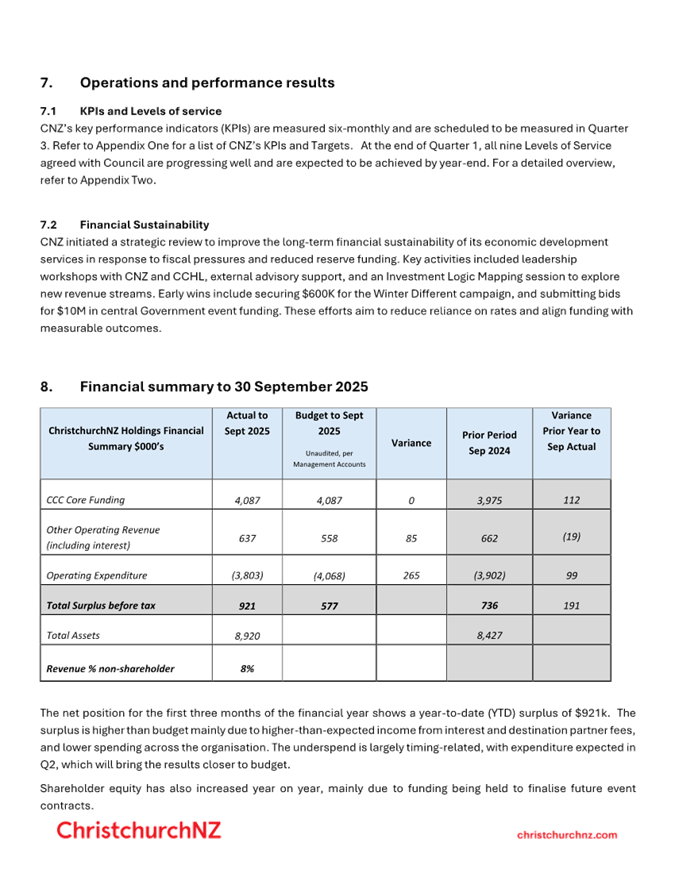
53 Hereford Street, Christchurch
Membership
|
Chairperson
Deputy Chairperson
Members
|
Councillor Sam MacDonald
Councillor Jake McLellan
Mayor Phil Mauger
Councillor David Cartwright
Councillor Melanie Coker
Councillor Pauline Cotter
Councillor Kelly Barber
Councillor Celeste Donovan
Councillor Tyrone Fields
Councillor Tyla Harrison-Hunt
Deputy Mayor Victoria Henstock
Councillor Nathaniel Herz Jardine
Councillor Yani Johanson
Councillor Aaron Keown
Councillor Andrei Moore
Councillor Mark Peters
Councillor Tim Scandrett
|
20 November 2025
Website: www.ccc.govt.nz
Finance and
Performance Committee of the Whole - Terms
of Reference
/ Ngā Ārahina Mahinga
|
 Chair Chair
|
Councillor
MacDonald
|
|
Deputy Chair
|
Councillor
McLellan
|
|
Membership
|
The Mayor and all councillors
are members of
this committee.
|
|
Quorum
|
Half of the members if the number of members (including vacancies) is even, or a majority of members if the number of members (including vacancies) is
odd
|
|
Meeting
Cycle
|
Monthly
|
|
Reports To
|
Council
|
Delegations
The Council delegates to
the Finance
and
Performance Committee authority
to
oversee and make decisions
on the following
matters:
Capital Programme and operational expenditure
·
Monitoring the delivery of the Council’s
Capital Programme and associated operational
expenditure,
including inquiring
into any material discrepancies
from planned expenditure.
·
Approving
amendments to the Capital Programme outside the Long-Term Plan or Annual Plan
processes.
·
Approving
Capital Programme investment cases, and associated operational expenditure, as
agreed in the Council’s Long-Term Plan.
·
Approving
any capital or other carry-forward requests and the use of operating surpluses.
·
Approving
the procurement plans (where applicable), preferred supplier, and contracts for
all capital expenditure where the value of the contract exceeds $15 million
(noting that the Committee may sub-delegate authority for approval of the
preferred supplier and /or contract to the Chief Executive, conditional on
compliance with the procurement plan strategy).
·
Approving the procurement plans (where applicable),
preferred supplier,
and contracts, for
all operational
expenditure
where the value of the contract exceeds $10 million (noting
that
the Committee may sub-delegate
authority for approval of the preferred supplier and/or contract to the Chief Executive, conditional on compliance with the procurement plan strategy).
Non-financial performance
·
Reviewing the delivery of services under
s17A.
·
Amending levels of
service targets, unless the decision is precluded
under section 97 of the Local Government Act 2002.
·
Exercising all of the Council's powers
under section 17A of the Local
Government Act 2002, relating to service
delivery reviews and decisions not to undertake a review.
·
Exercising all of the Council's powers under
section 17A of the Local Government Act 2002, relating to service delivery
reviews and decisions not to undertake a review.
Council Controlled Organisations
·
Monitoring the financial and non-financial
performance of the Council
and Council-controlled Organisations.
·
Making
governance decisions
related to Council
Controlled Organisations under sections 65
to 72 of the
Local Government Act
2002.
·
Exercising the Council’s powers
directly as the shareholder, or through CCHL, or in
respect of an entity
(within
the meaning of section
6(1) of the Local Government Act 2002) in relation to:
-
(without limitation)
the
modification of constitutions and/or trust deeds, and
other governance arrangements,
granting shareholder approval of
major transactions,
appointing directors or trustees, and approving
policies related
to Council Controlled
Organisations; and
-
in relation to
the approval of Statements of Intent and
their modification (if any).
Development
Contributions
·
Exercising all of the Council's powers
in relation to development
contributions,
other than those delegated to the Chief Executive and
Council officers as set out in the Council's Delegations Register.
Property
·
Purchasing or disposing
of property where required for the delivery of the Capital Programme, in accordance with
the
Council’s Long-Term Plan, and where those
acquisitions or disposals
have
not
been delegated to another decision-making body of the
Council or staff.
Loans and debt write-offs
·
Approving debt write-offs where those debt write-offs are not delegated to staff.
·
Approving amendments
to
loans, in accordance with the Council’s Long-Term Plan.
Insurance
·
All insurance matters,
including considering legal
advice from the Council’s
legal and other advisers,
approving further actions
relating
to
the issues, and authorising
the taking of formal actions
(Sub-delegated
to
the Insurance Subcommittee
as per the Subcommittees
Terms of Reference).
Annual Plan and Long Term Plan
·
Providing oversight and monitoring development of the Long Term Plan (LTP) and Annual
Plan.
Submissions
·
The Council
delegates to
the
Committee authority:
-
To consider
and
approve draft
submissions on behalf of the
Council on topics within its
terms of reference. Where the timing of a consultation does
not allow for consideration of a draft submission by the Council
or relevant Committee,
the
draft submission can
be considered and
approved on behalf of the
Council.
Limitations
·
The general delegations to this Committee
exclude any specific decision-making powers that are delegated to a Community
Board, another Committee of Council or Joint Committee. Delegations to staff
are set out in the delegations register.
·
The Council retains the authority to adopt policies, strategies
and bylaws.
The following matters
are prohibited from being subdelegated in accordance with LGA 2002 Schedule 7
Clause 32(1) :
·
the power to make a rate; or
·
the power to make a bylaw; or
·
the power to borrow money, or purchase or
dispose of assets, other than in accordance with the long-term plan; or
·
the power to adopt a long-term plan, annual
plan, or annual report; or
·
the power to appoint a chief executive; or
·
the power to adopt policies required to be
adopted and consulted on under this Act in association with the long-term plan
or developed for the purpose of the local governance statement; or
·
the power to adopt a remuneration and employment
policy.
Chairperson
may refer urgent matters to the Council
As may be necessary from
time to time, the Committee Chairperson is authorised to refer urgent matters
to the Council for decision, where this Committee would ordinarily have
considered the matter. In order to
exercise this authority:
·
The Committee Advisor must inform the
Chairperson in writing of the reasons why the referral is necessary
·
The Chairperson must then respond to the
Committee Advisor in writing with their decision.
·
If the Chairperson agrees to refer the report to
the Council, the Council may then assume decision-making authority for that
specific report.
Urgent
matters referred from the Council
As may be necessary
from time to time, the Mayor is authorised to refer urgent matters to this
Committee for decision, where the Council would ordinarily have considered the
matter, except for those matters listed in the limitations above.
In order to
exercise this authority:
·
The Council Secretary must inform the Mayor and
Chief Executive in writing of the reasons why the referral is necessary
·
The Mayor and Chief Executive must then respond
to the Council Secretary in writing with their decision.
If the Mayor
and Chief Executive agree to refer the report to the Committee, the Committee
may then assume decision-making authority for that specific report.
Part A Matters
Requiring a Council Decision
Part B Reports
for Information
Part C Decisions
Under Delegation
TABLE OF CONTENTS NGĀ IHIRANGI
Karakia Tīmatanga................................................................................................... 7
C 1. Apologies Ngā Whakapāha.......................................................................... 7
B 2. Declarations of Interest Ngā Whakapuaki Aronga........................................... 7
B 3. Public Forum Te Huinga Whānui.................................................................. 7
B 4. Deputations by Appointment Ngā Huinga
Whakaritenga................................. 7
B 5. Presentation
of Petitions Ngā
Pākikitanga.................................................... 7
Staff Reports
B 6. Key
Organisational Performance Results - October 2025................................. 9
B 7. Financial
Performance Report - October 2025.............................................. 53
C 8. Capital
Programme Performance Report October 2025................................. 69
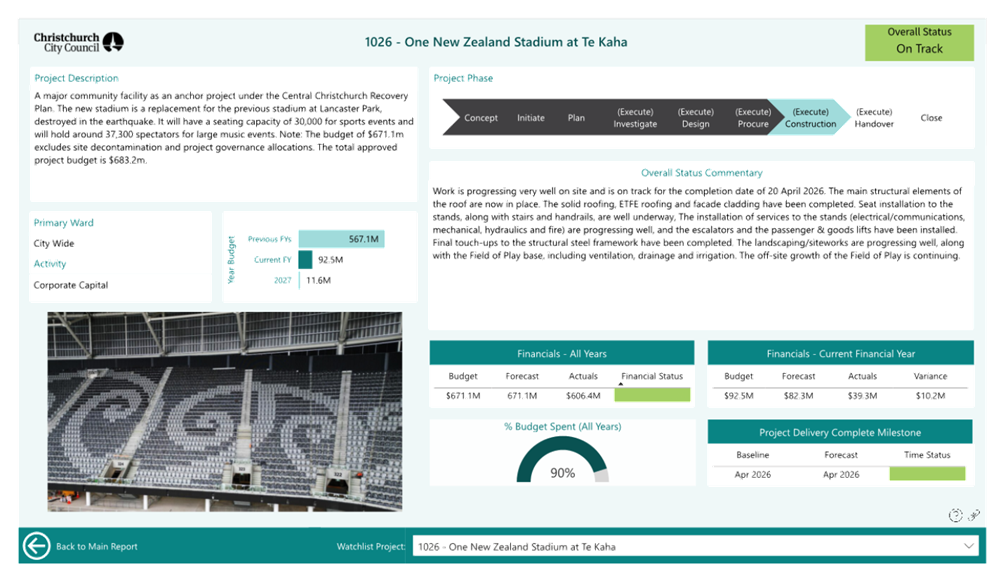
B 9. One
New Zealand Stadium at Te Kaha - Elected Members' Update................. 109
B 10. Christchurch
City Holdings Ltd - Annual Report 2024/25.............................. 111
C 11. ChristchurchNZ
Holdings Ltd - Annual Report 2024/25................................. 223
B 12. Council-controlled
Organisations - Annual Reports 2024/25......................... 309
C 13. Council-controlled
organisations - Annual General Meetings by Written Resolution............................................................................................................ 511
C 14. Resolution
to Exclude the Public.............................................................. 521
Karakia Whakamutunga
Karakia Tīmatanga
Whakataka te hau ki te uru
Whakataka te hau ki te tonga
Kia mākinakina ki uta
Kia mātaratara ki tai
E hī ake ana te atakura
He tio, he huka, he hau hū
Tihei mauri ora
1. Apologies Ngā Whakapāha
Apologies will
be recorded at the workshop.
2. Declarations of Interest Ngā
Whakapuaki Aronga
Members are
reminded of the need to be vigilant and to stand aside from decision-making
when a conflict arises between their role as an elected representative and any
private or other external interest they might have.
3. Public Forum Te Huinga Whānui
A period of up
to 30 minutes will be available for people to speak for up to five minutes on
any issue that is not the subject of a separate hearing process.
Public Forum presentations will be
recorded in the meeting minutes
4. Deputations by Appointment Ngā Huinga
Whakaritenga
Deputations may
be heard on a matter, or matters, covered by a report on this agenda and
approved by the Chairperson.
Deputations will
be recorded in the meeting minutes.
5. Presentation of Petitions Ngā
Pākikitanga
There were no petitions
received at the time the agenda was prepared.
|
6. Key
Organisational Performance Results - October 2025
|
|
Reference Te Tohutoro:
|
25/2155052
|
|
Responsible Officer(s) Te Pou Matua:
|
Peter
Ryan, Head of Corporate Planning & Performance
Peter.Ryan@ccc.govt.nz
|
|
Accountable ELT Member Pouwhakarae:
|
Bede
Carran, General Manager Finance, Risk & Performance / Chief Financial
Officer
|
1. Purpose and Origin of the Report Te Pūtake Pūrongo
1.1 To
provide Council with an overview of organisational performance towards
delivering the second year of its Long-Term Plan 2024-34 (LTP), our
‘contract with the community’.
2. Officer Recommendations Ngā Tūtohu
That the Finance and
Performance Committee:
1. Receives the information in the Key Organisational Performance Results -
October 2025 Report.
3. Background/Context Te Horopaki
3.1 This
is a standing report focused on a suite of the ‘vital few’
organisational performance targets and is a key component of the
Council’s Performance Framework and its reporting.
4. Considerations Ngā Whai Whakaaro
4.1 The
key organisational performance targets include:
· Service Delivery (levels of service (LOS)).
· Capital Projects (both milestone delivery and planning).
· Value for Money (finance – activity budgets and capital programme budgets).
4.2 This
report provides the first year end performance forecasts and report for the new
triennium against Executive Leadership Team (ELT) performance priority targets
for year two of the LTP 2024-34.
4.3 The
table below summarises performance against the targets.
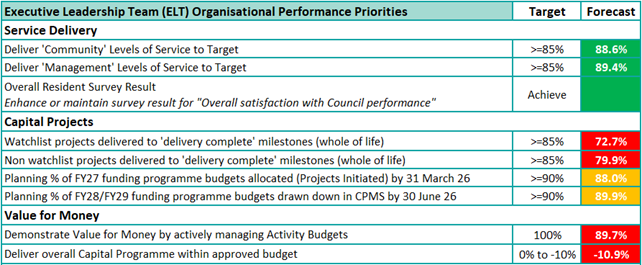
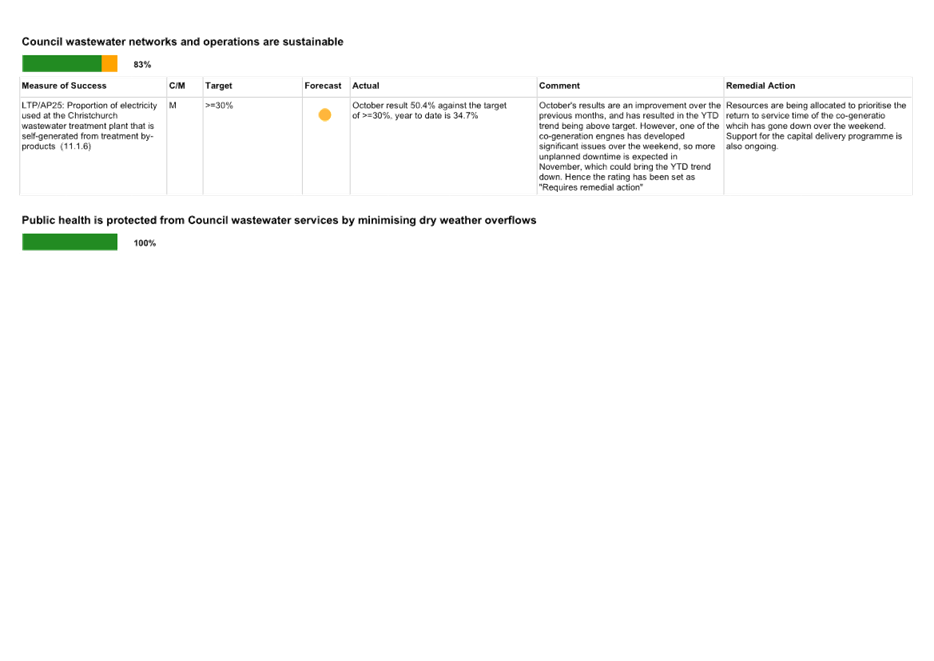
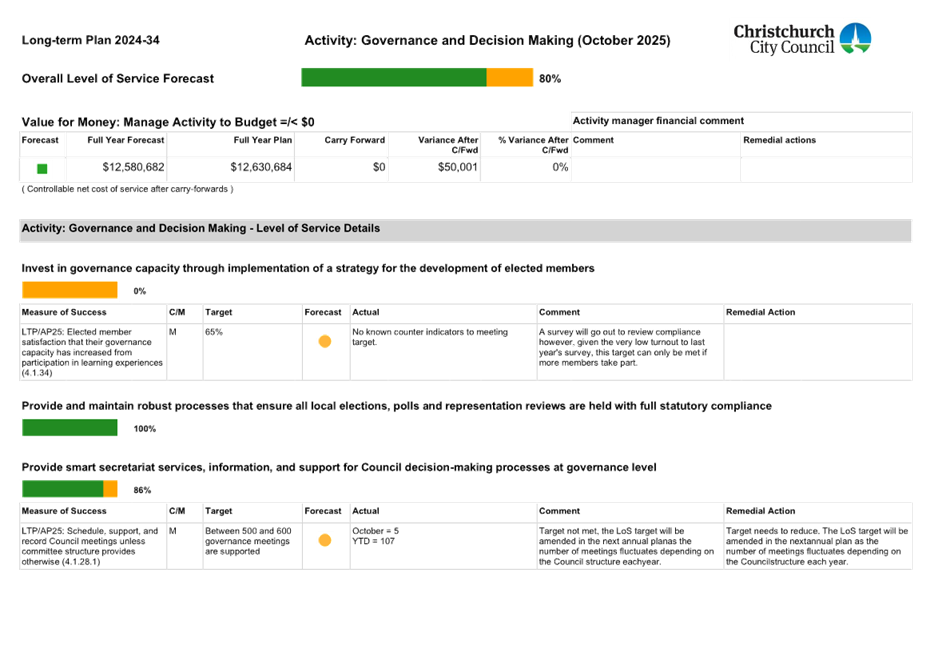
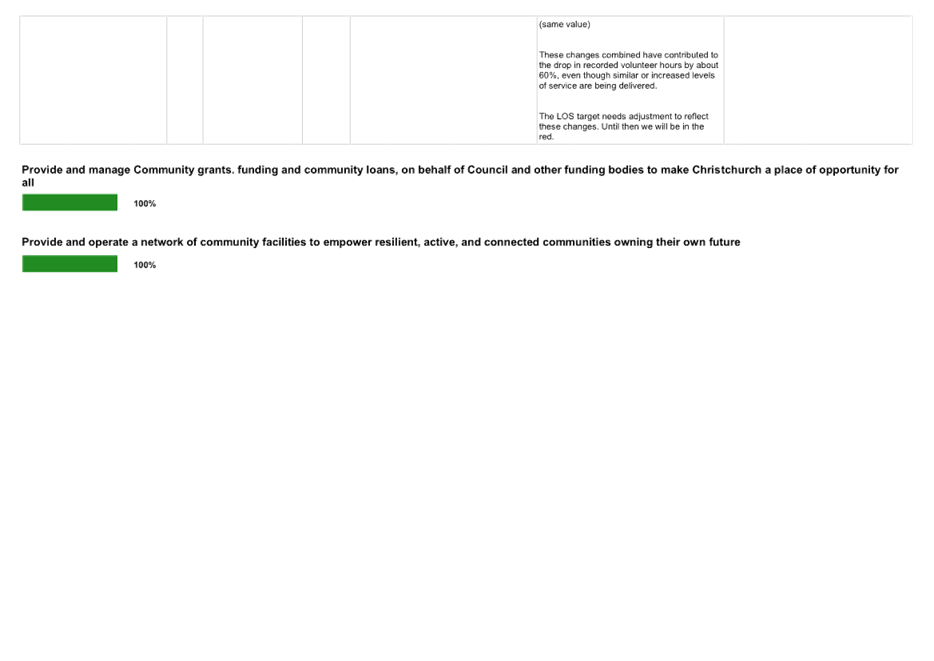
4.1 Community
Level of Service delivery is forecast at 88.6%, it is showing improvement from
management reporting for September, and slightly ahead of the year end (YE)
position for 2024/25. This is tracking to achieve the ELT performance target of
85%.
4.2 Management
Level of Service delivery is forecast at 89.4%, it is showing a slight decrease
from management reporting for September but is slightly ahead of the YE
position for 2024/25. This is tracking to achieve the ELT performance target of
85%.
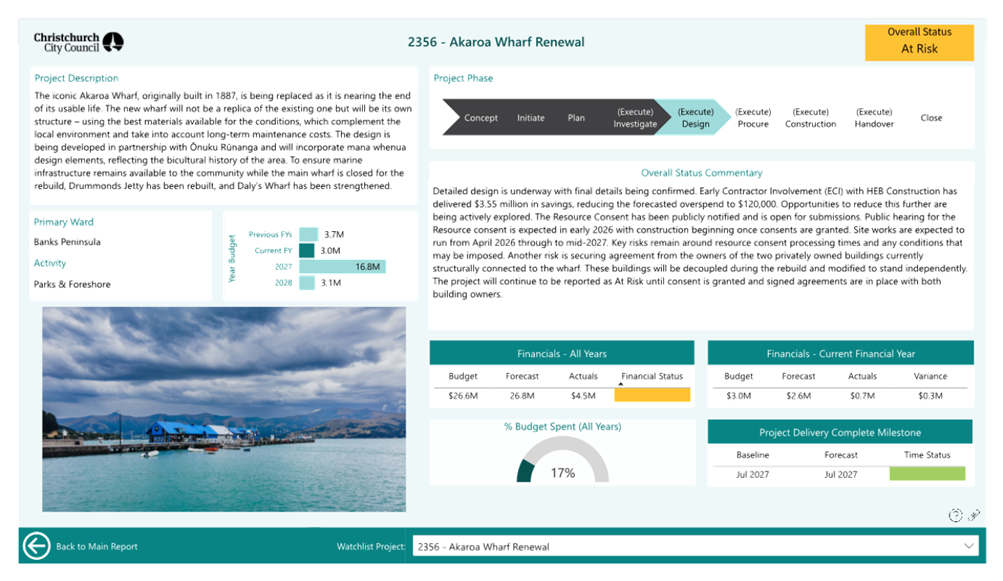
4.3 Watchlist
project milestone delivery is forecast at 72.7%, showing no change from
management reporting for September and behind the combined year-end result for
2024/25 (80.2%). This is forecast to not achieve the ELT performance target of
85%.
4.4 Non
watchlist project milestone delivery is forecast at 79.9%. This is an
improvement from management reporting for September, and slightly behind the
previous FY finishing position (80.2%). This is forecast to not achieve the ELT
performance target of 85%.
4.5 FY2027 Capital programme
planning is forecast at 88.0%, forecasting close to
achieving the ELT performance target of 90% if current progress is increased
incrementally.
4.6 FY2028/2029
Capital programme planning is forecast at 89.9%, also forecasting close to
achieving the ELT performance target of 90% if current progress is maintained.
4.7 Activity
budgets, actively managed to budget is forecast at 89.7%, and forecast to not
achieve the ELT organisational target of 100% of activities are actively
managed to budget.
4.8 Deliver
Capital Programme within approved budget is forecast at -10.9%, forecast to not
achieve the ELT target of 0% to -10%.
4.9 Additional detail and explanation on performance
against targets for each of the categories is provided below.
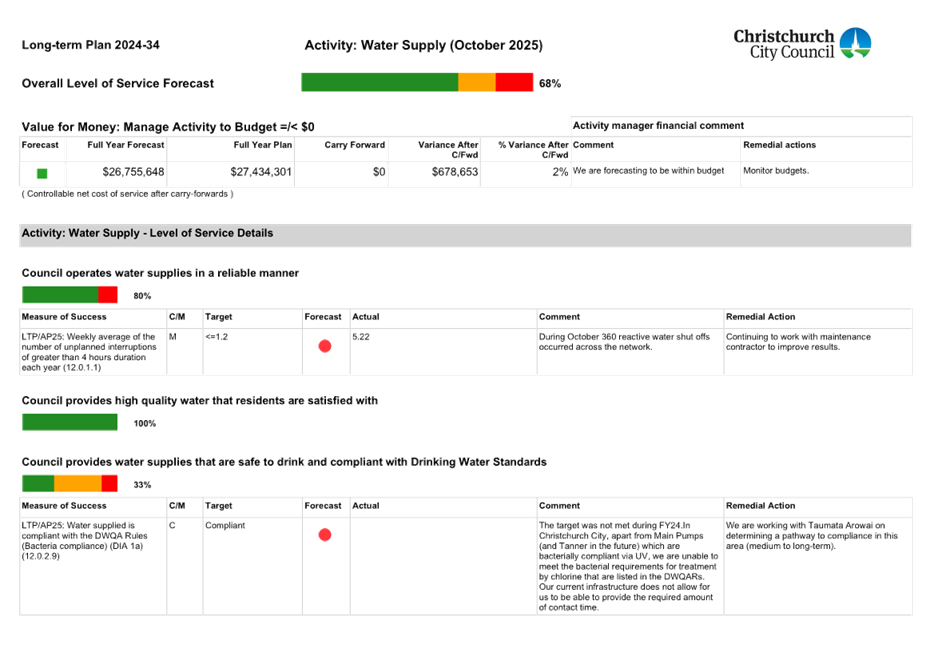
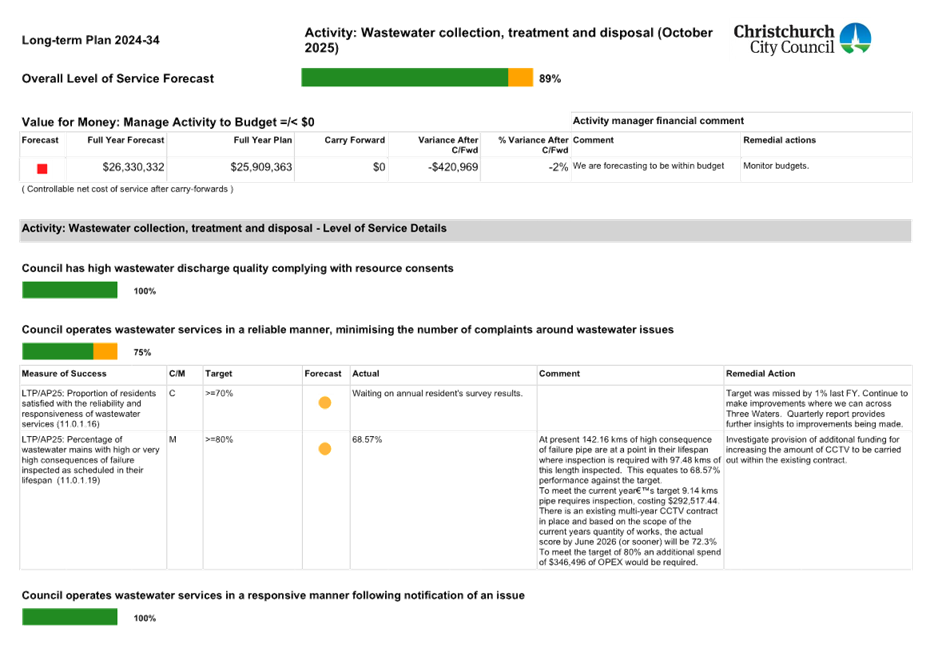
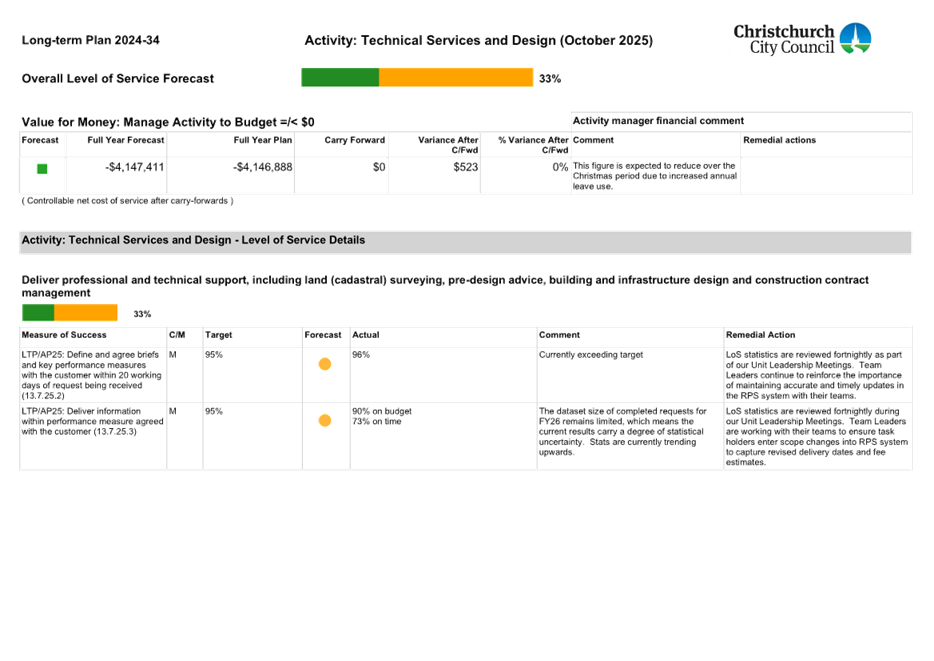
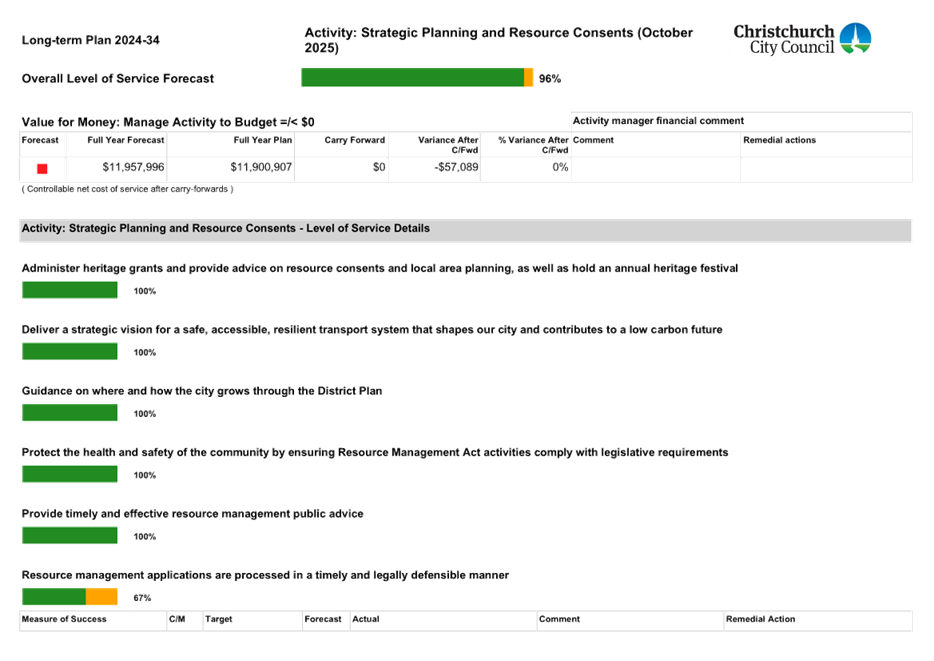
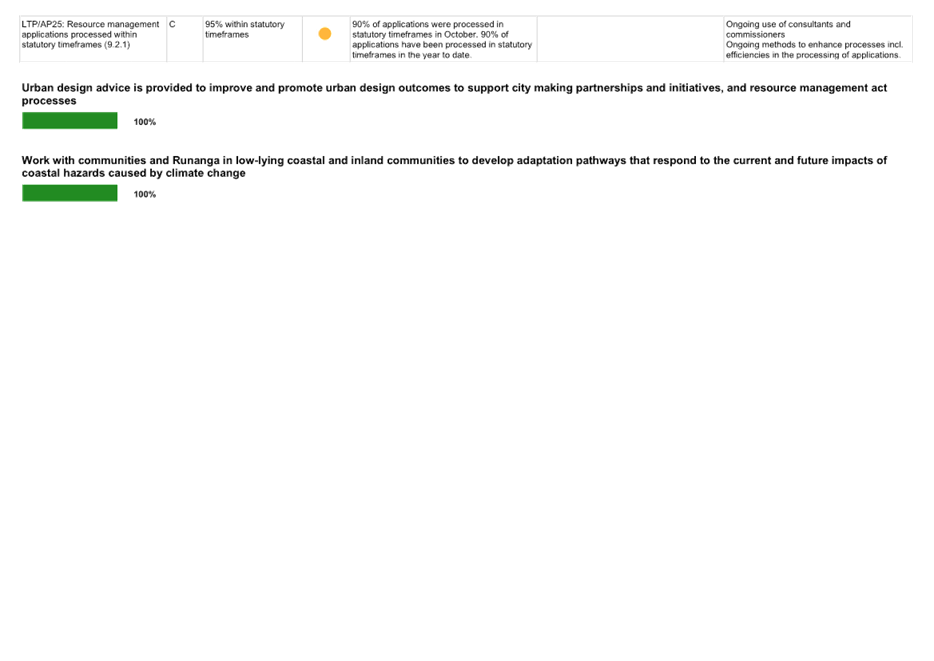
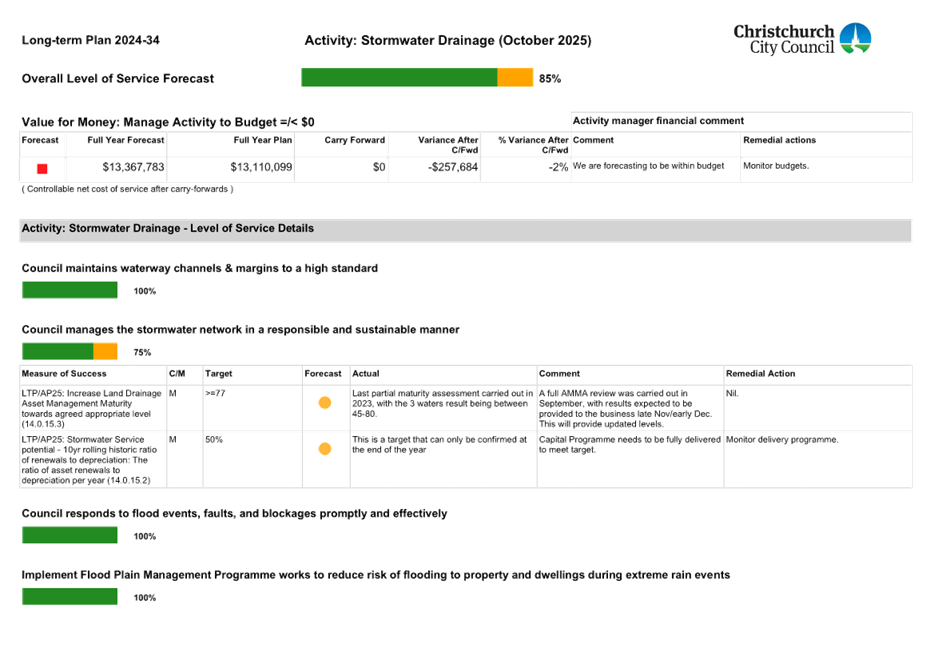
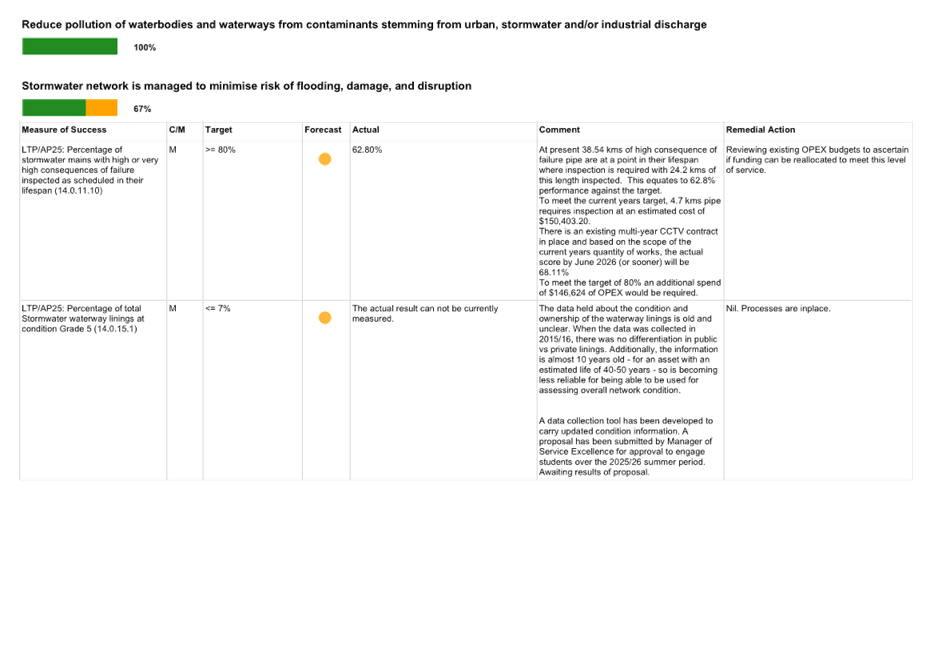
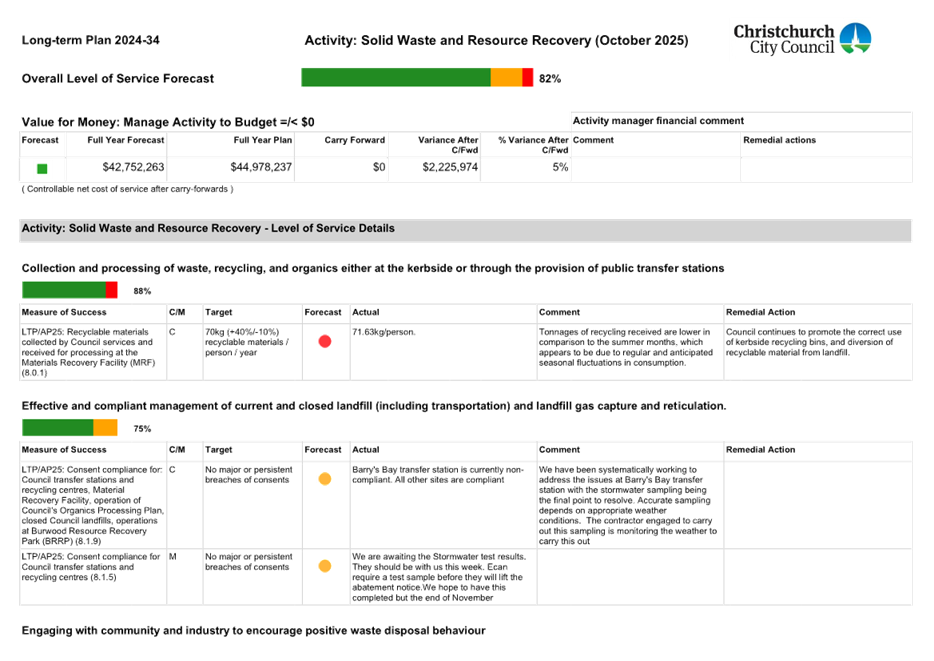
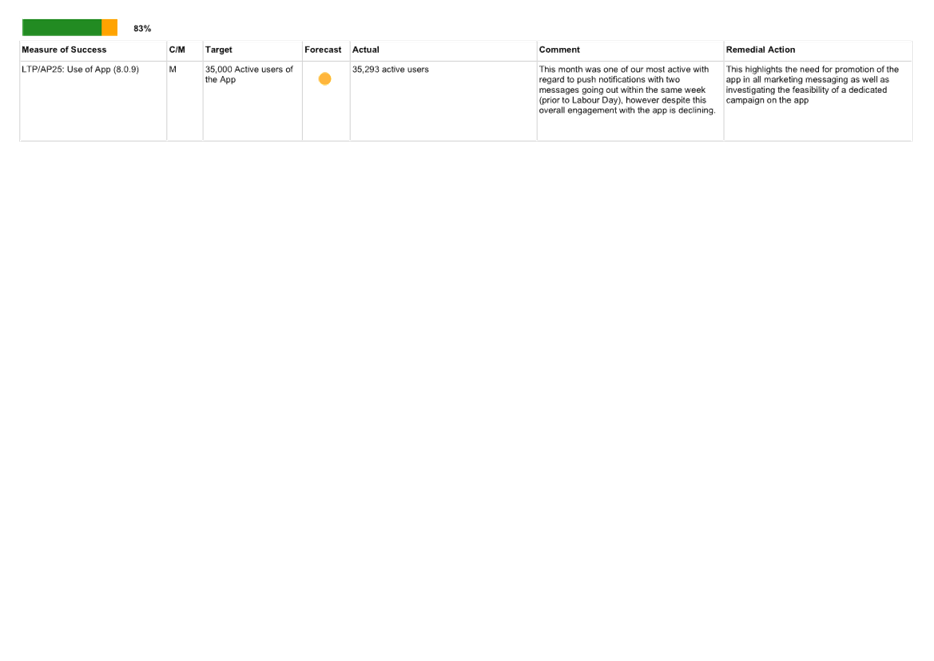
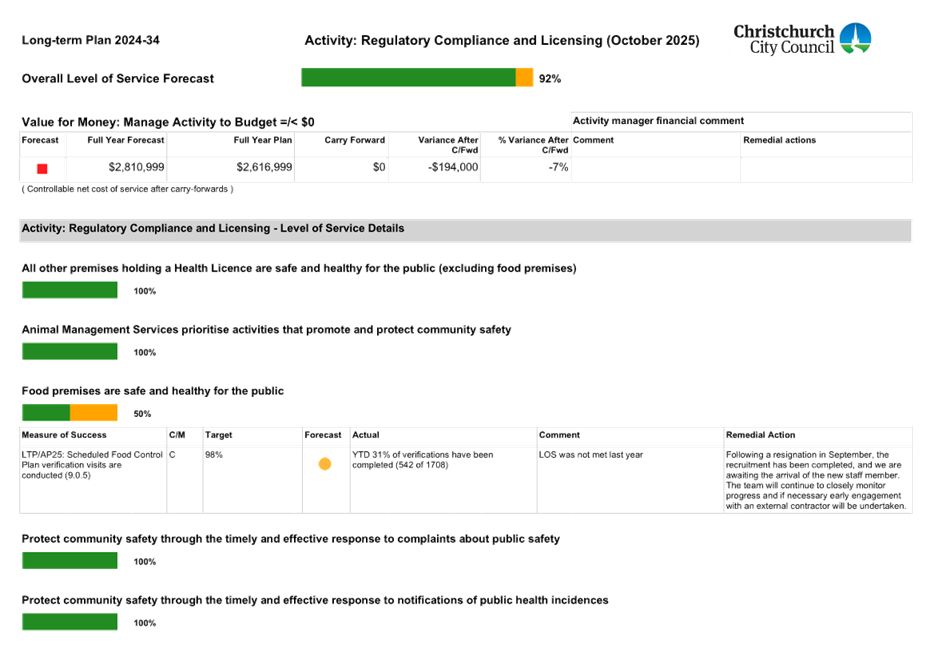
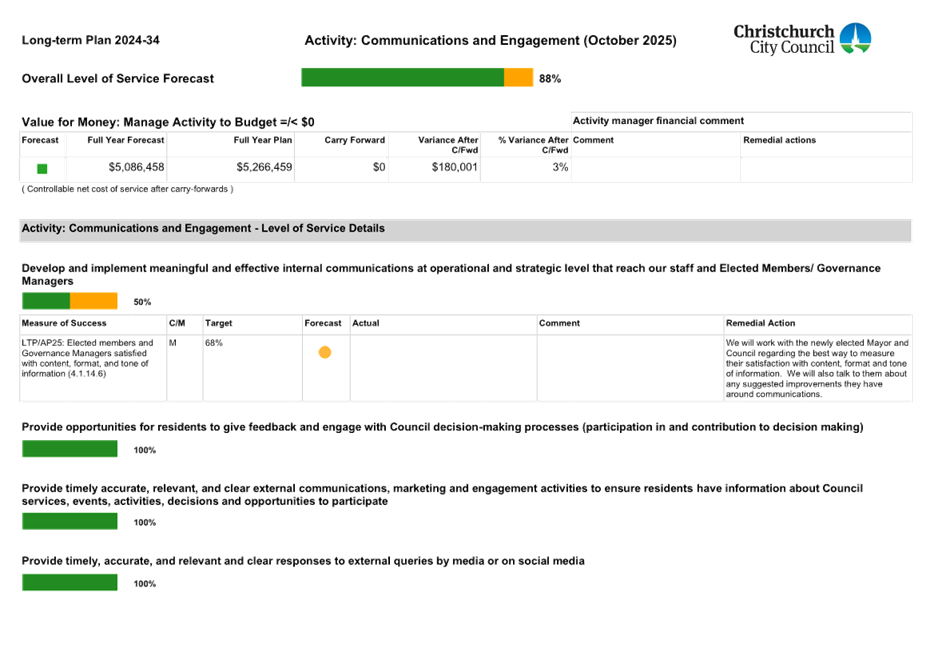
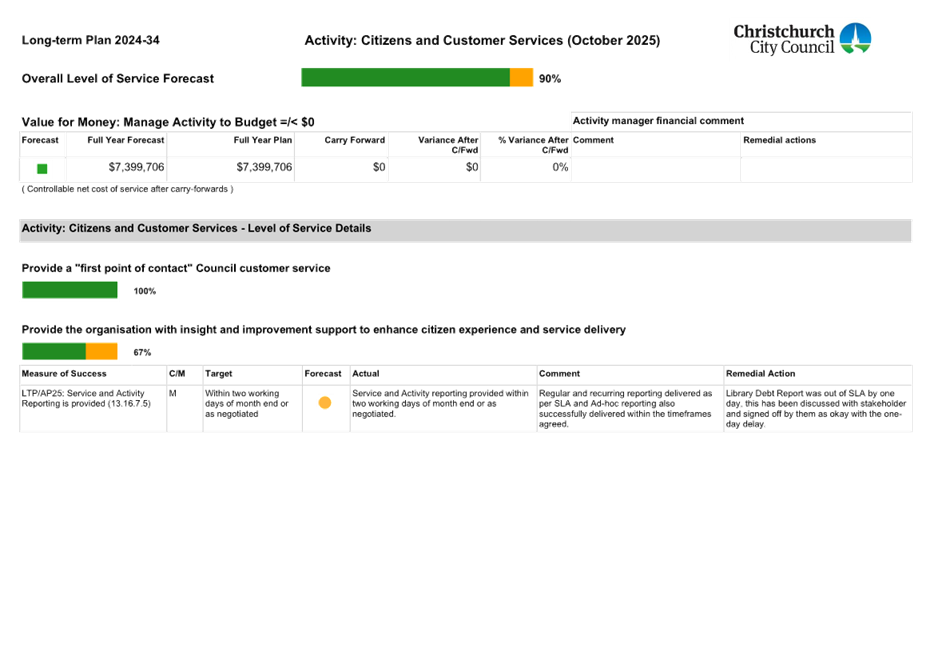
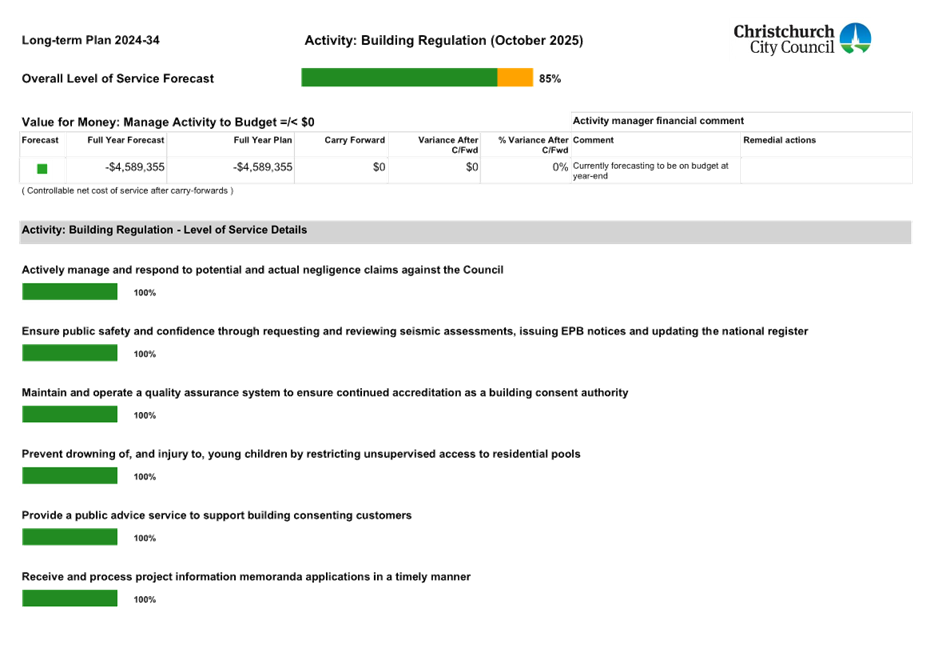
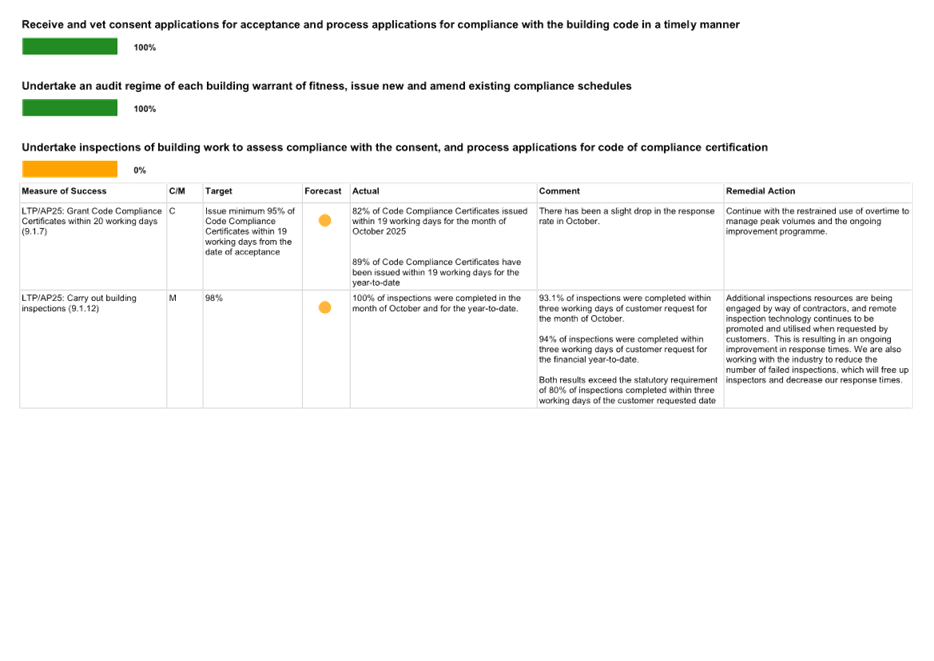
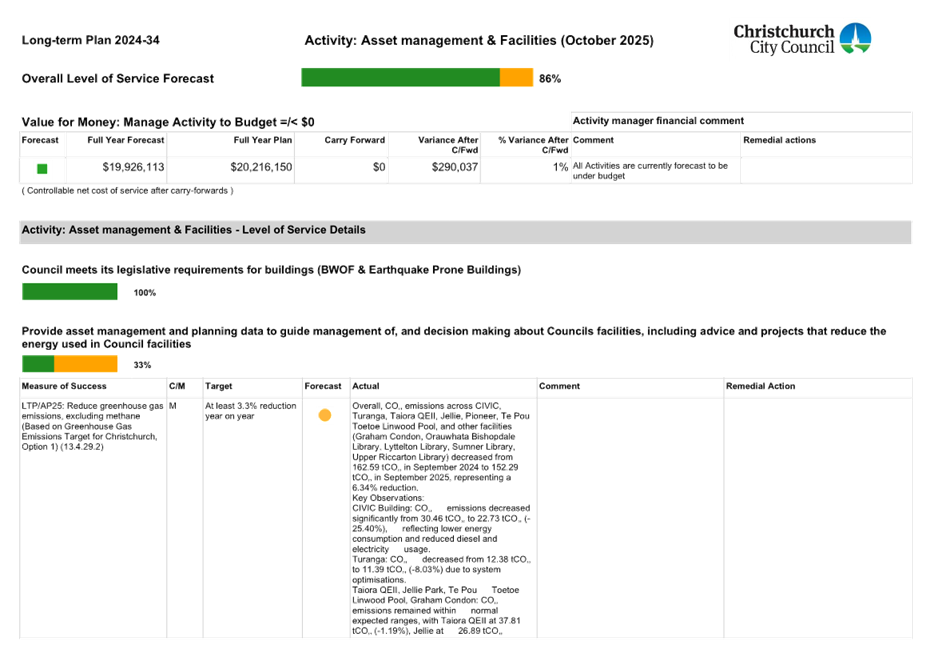
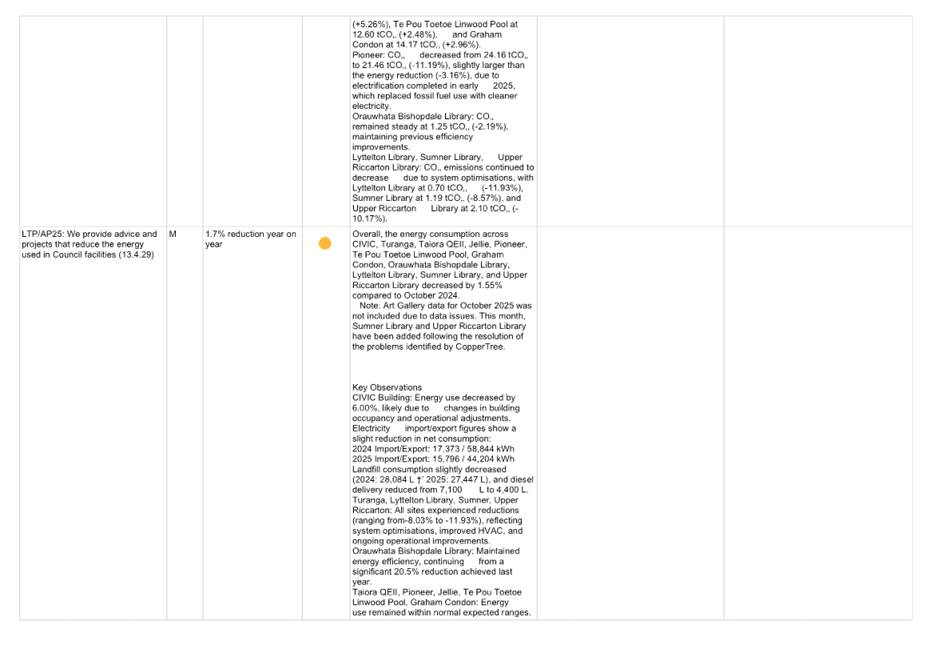
5. Service Delivery
5.1 The
table below provides a summary of forecast level of service achievement for the
organisation (all activities) against the performance targets. Additional
information provides context and background; whether the target is forecast to
be met, percentage forecast variance and relative movement compared to the
previous reporting period, a count of levels of service, and the last three
years year-end performance results.
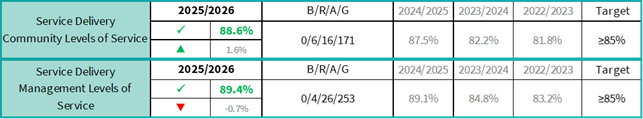 *B = Black, no data. R = Red, will miss target. A = Amber, requires
intervention. G = Green, will achieve target.
*B = Black, no data. R = Red, will miss target. A = Amber, requires
intervention. G = Green, will achieve target.
5.2 Community
Level of Service delivery is forecast at 88.6%, an increase of 1.6% from
management reporting for September. At year-end June 2025 the result was 87.6%.
5.3 Management
Level of Service delivery is forecast at 89.4%, a decrease of 0.7% from
management reporting for September. The forecast remains consistent with the
year-end position for 2024/25 (89.1%).
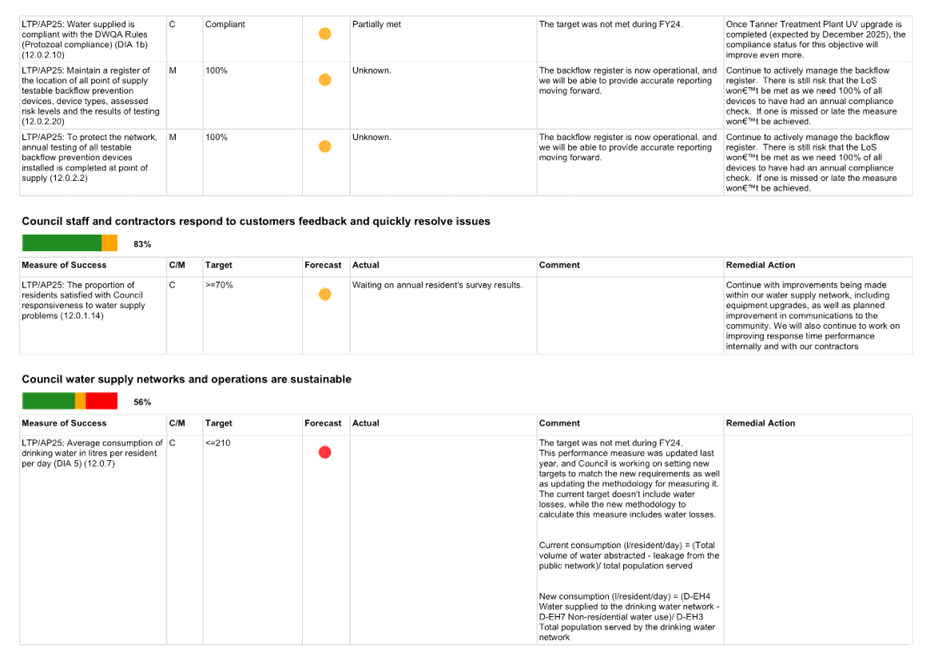
5.4 Attachment
A, provides details for the level of service exceptions, including manager
comments and remedial actions.
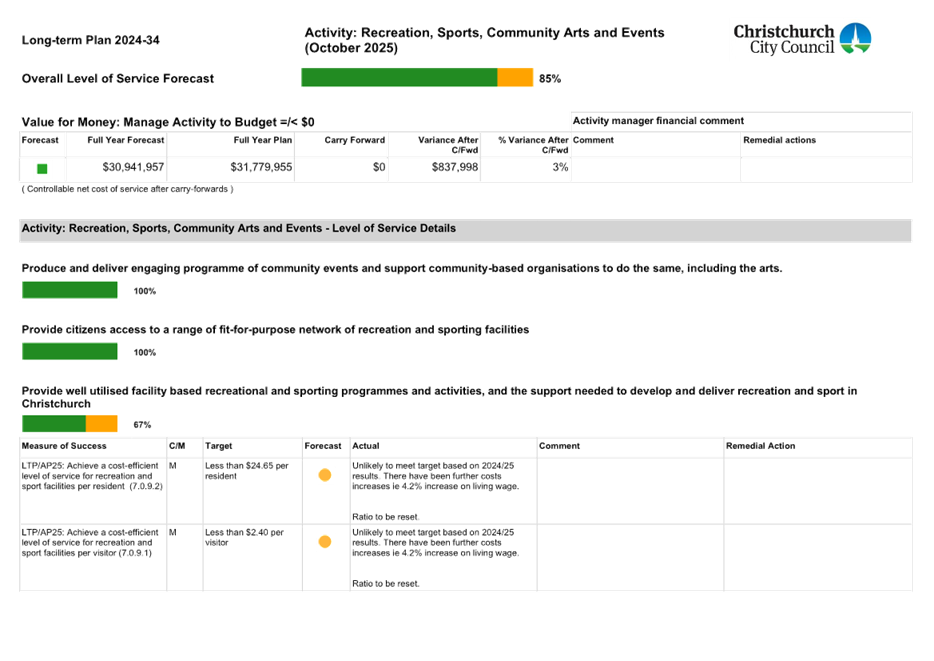
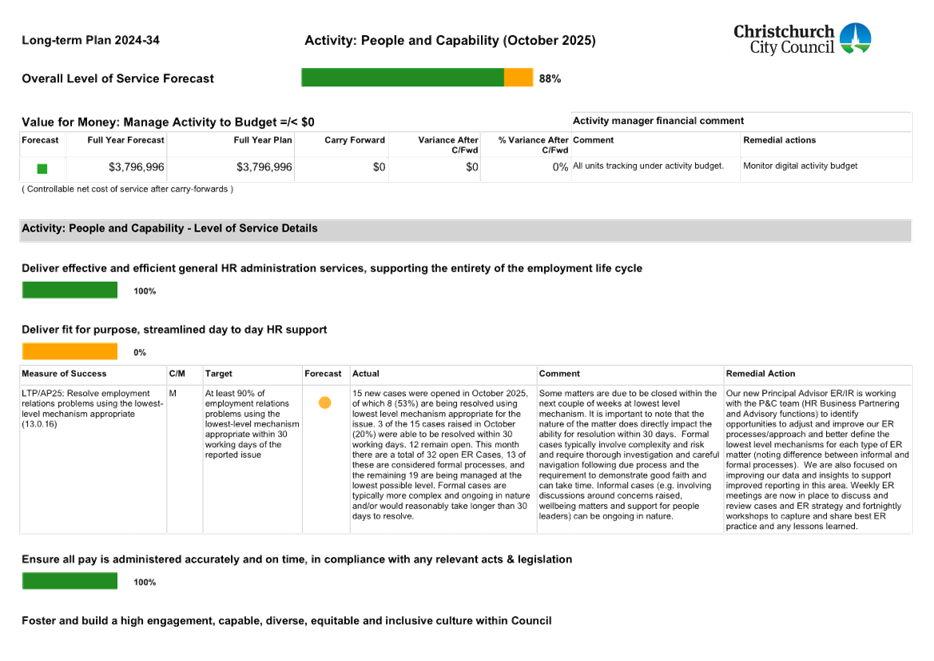
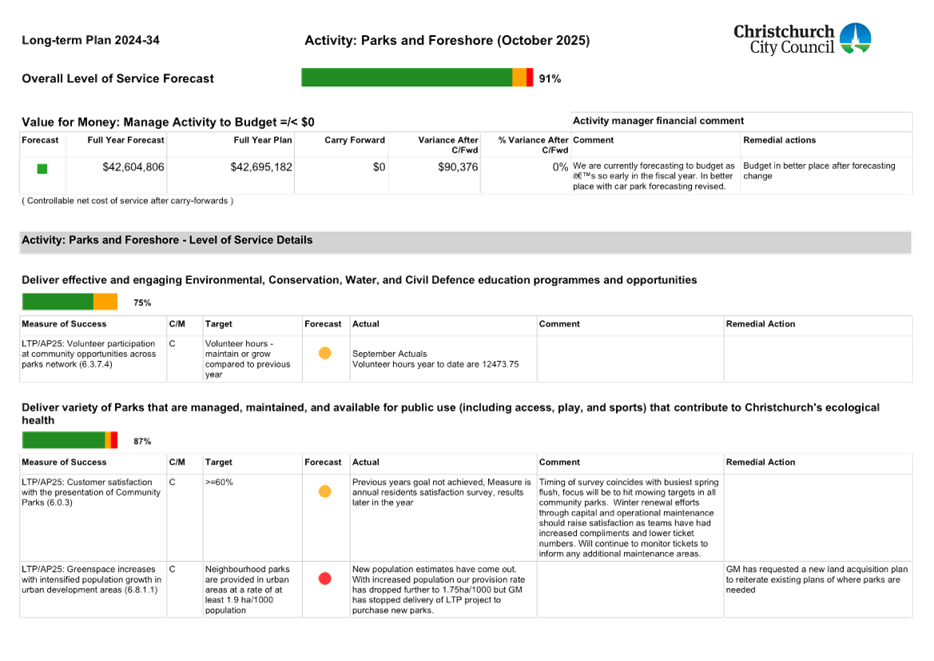
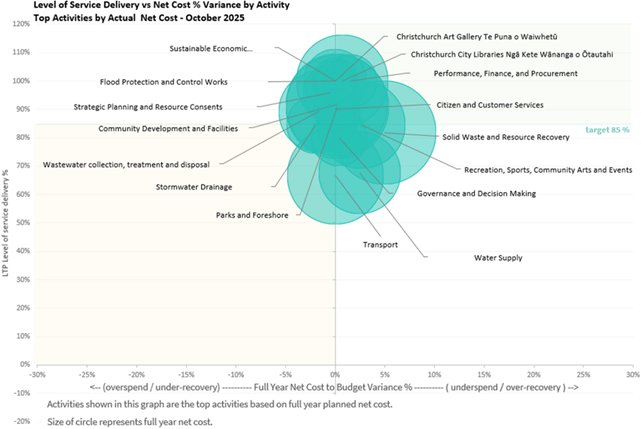
5.5 The
scatter-diagram below shows forecast activity LOS delivery performance
(Community and Management LOS), against forecast activity budget performance
(over- or under-spend), noting:
· across all listed
activities, level of service delivery forecasts range from 67.7% to 100%
· the vertical y-axis shows
forecast service delivery (LOS) performance.
· the horizontal x-axis shows forecast budget over/underspend (scaled
to relative budget).
· while some activities are unfavourable against budget overall
Council is within budget.
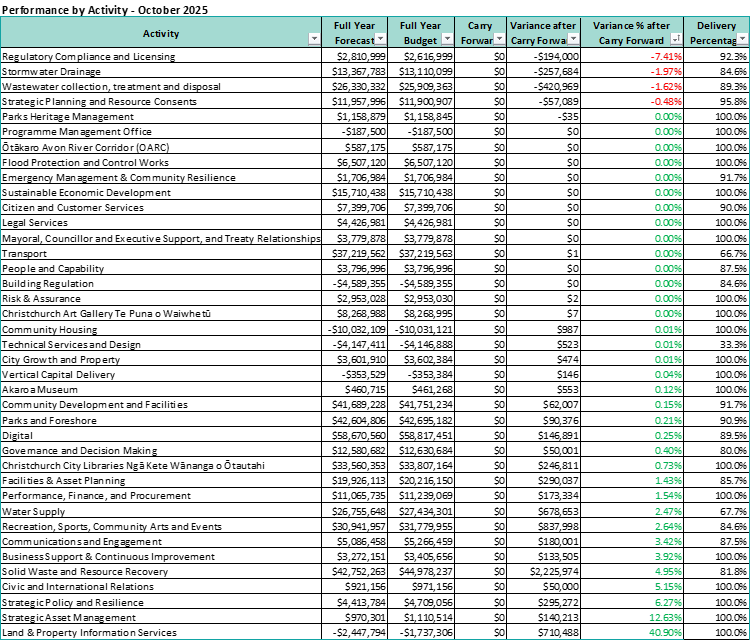
5.6 The
table below the scatter diagram provides further detail on all of
Council’s activities, and their level of service delivery against budget.
6.  ELT Performance Priority: Capital Projects delivery
6.1 The
table below provides a summary on the capital project delivery against
milestones, noting that spend against budget are set out in the Financial
Performance Report and the Capital Programme Performance Report.
6.2 Capital
Watchlist project milestone delivery performance is forecast at 72.7%. This is
forecast to not achieve the ELT target of 85%.
6.3 Capital
Non-Watchlist projects milestone delivery performance is forecast at 79.9%,
which is forecast to not achieve the ELT
target of 85%.
6.4 Both
forecasts are presently behind the overall combined capital project milestone
delivery result for 2024/25, 80.2%.
Capital project planning
6.5 Council
also monitors capital project planning as a lead indicator of future capital
project delivery. The table below summarises the forward view of project
planning.
6.6 Capital projects planning %
for FY2027 is forecast at 88.8%, an increase of
0.4% from management reporting for September and remains forecast close to the
ELT target of 90%.
6.7 Capital
projects planning % for FY2028/2029 is forecast at 89.8%, an increase of 1.1%
from September, also remaining forecast close to the ELT target of 90%.
6.8 Forecasts
for both targets are in line with year-end for 2024/25, and ahead of the same
point in time last year. There is sufficient time remaining this financial year
for these ELT performance targets to be met if current progress is increased
incrementally.
6.9 For
further information and underlying project detail, refer to the Capital
Programme Performance Report.
7. ELT Performance Priority: Value for Money
7.1  A key performance measure is value for
money, and whether activities are operating within the budgets for controllable
costs, and the forecast for the year end. The table below summarises the
year end position based on current performance (note also the detail provided
earlier in the report (refer to the table at Section 5 Performance by
Activity).
A key performance measure is value for
money, and whether activities are operating within the budgets for controllable
costs, and the forecast for the year end. The table below summarises the
year end position based on current performance (note also the detail provided
earlier in the report (refer to the table at Section 5 Performance by
Activity).
7.2 89.7% (35/39) of activities are forecast to achieve budget (nett
controllable cost, after carry-forwards). While some
activities are unfavourable against budget, overall Council is within budget. Attachment A (summary of performance targets for major
Council activities, with detailed levels of service results, exceptions,
activity budget results, with manager commentary) and the Financial Performance
Report provide analysis of the exceptions and variances.
7.3 As
part of determining value for money, capital expenditure against budgeted
expenditure is also monitored. The table below summarises the forecast
capital spend, and shows that capital expenditure is forecast to not meet the
ELT’s target of between 0% to -10%.

7.4 The
ELT performance target reporting includes Council’s core and externally
funded work, regardless of funding source, but excludes One New Zealand Stadium
at Te Kaha.
7.5 The
current year forecast variance of -10.9% compares with the prior year’s
year end result of
-13.3% (current year budget of $561.2M / forecast underspend -$61.2M, compares
with last year-end budget $553.7M / underspent by -$73.4M).
7.6 More
detailed information is available in the Financial and Capital Programme
Performance reports.
7.7 Set out below is the forward view of capital delivery performance for the LTP 2024-34
(financial), which looks at commitments for the first few years of the LTP
2024-34, accompanied by confirmed capital delivery in preceding LTP-cycles
against plan.
7.8  This view includes the adopted capital programme
from the LTP 2024-34 as updated through the 2025/26 Annual Plan.
This view includes the adopted capital programme
from the LTP 2024-34 as updated through the 2025/26 Annual Plan.
7.9 This
also includes adjustments to budgets for years 2025/26 to 2027/28 for
carry-forwards
(-$57.4M) as approved through the Financial Performance Report – June
2025, by Finance and Performance Committee, Part C
(3)).
7.10 The
extended black line is the full planned delivery budget including One New
Zealand Stadium at Te Kaha (as adopted through the Annual Plan 2025/2026)
(including confirmed carry forwards).
7.11 The extended blue line shows the full Council
planned delivery budget (excluding One New Zealand Stadium at Te Kaha,
including confirmed carry forwards):
· from a consistent $488M to
$483M planned budget for the previous three years (2021-2024);
· to $554M for 2025, to
between $561M to $775M (back to $711M) planned budget for the years
(2026-2028), noting that the Programme Management Office (PMO), as part of the
2026/27 Annual Plan preparation continues to review the capital programme for
deliverability.
7.12 The Council capital delivery (green line) for
2025/2026 is forecasted at $500M against the programme budget of $561M
(rounded) (blue line). This equates to 89.1% of budget spent.
7.13 It
is important to note that the forecast capital programme for outer years does
not yet incorporate the updates from the PMO’s review of deliverability.
Updates are applied once Council formally adopt the changes (generally at the
draft AP and/or final AP adoptions).
7.14 Figures
align with the Financial and Capital Programme Performance reports.
8. Responses to questions from Councillors
8.1 There
are no outstanding questions from Councillors.
Attachments Ngā Tāpirihanga
|
No.
|
Title
|
Reference
|
Page
|
|
a ⇩ 
|
Service
Delivery Summary (Levels of Service)
|
25/2327127
|
16
|
In addition to the attached documents, the following background
information is available:
|
Document
Name – Location / File Link
|
|
Not
applicable
|
Signatories Ngā Kaiwaitohu
|
Authors
|
Amber Tait -
Performance Analyst
Boyd Kedzlie -
Senior Corporate Planning & Performance Analyst
|
|
Approved By
|
Peter Ryan -
Head of Corporate Planning & Performance
Bede Carran -
General Manager Finance, Risk & Performance / Chief Financial Officer
|
|
7. Financial
Performance Report - October 2025
|
|
Reference Te Tohutoro:
|
25/2270164
|
|
Responsible Officer(s) Te Pou Matua:
|
Bruce
Moher, Head of Finance
|
|
Accountable ELT Member Pouwhakarae:
|
Bede
Carran, General Manager Finance, Risk & Performance / Chief Financial
Officer
|
1. Purpose and Origin of the Report Te Pūtake Pūrongo
1.1 The
purpose of this report is to inform
the Committee on Council's financial performance to 31 October 2025, which
includes providing an updated year-end forecast.
1.2 This is a standing report that is presented to
the Committee.
2. Officer Recommendations Ngā Tūtohu
That the Finance and
Performance Committee:
1. Receives the information in the Financial Performance Report - October 2025 Report.
3. Executive Summary Te Whakarāpopoto Matua
3.1 This is the first report for 2025/26 and the new triennium, and it
includes quarterly information on the Treasury function, rates, excess water
and general debt, and insurance claims. A breakdown of financial performance by
Activity is also included (refer Attachment A).
3.2 The
year-to-date operational surplus of $60.3m is $27.7m greater than budget. This
is driven by: savings in insurance costs, reduced personnel costs due to staff
vacancies, lower than budget landfill and resource recovery operations, a
strong building market increasing consenting revenue, increased recreation and
sports participation revenues and late rating growth.
3.3 The
forecast year end operating surplus is currently $14.3m. This is driven by:
$1.0m additional revenue (primarily related to rates and LIM & property
files) and lower forecast costs of approximately $13.5m primarily, $7.2m of
insurance renewal savings, $2.6m personal costs due to vacancies, $2.2m in
landfill and resource recovery operations and reduced rates of $1.7m on Council
owned properties due to the rates reductions arising after budgets had been
set.
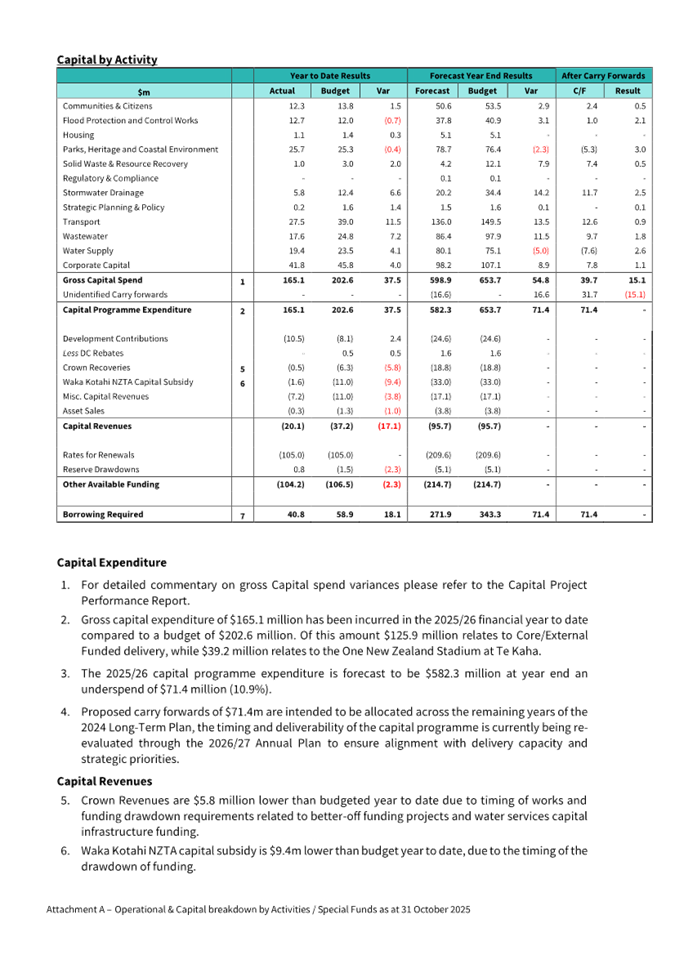
3.4 The capital programme delivery is below budget year to date
by $37.5m, primarily in the areas of Transport ($11.5m) and Three Waters
($17.3m). The Project Management Office (PMO) forecasts the underspend to
extend to $71.4m by year end.
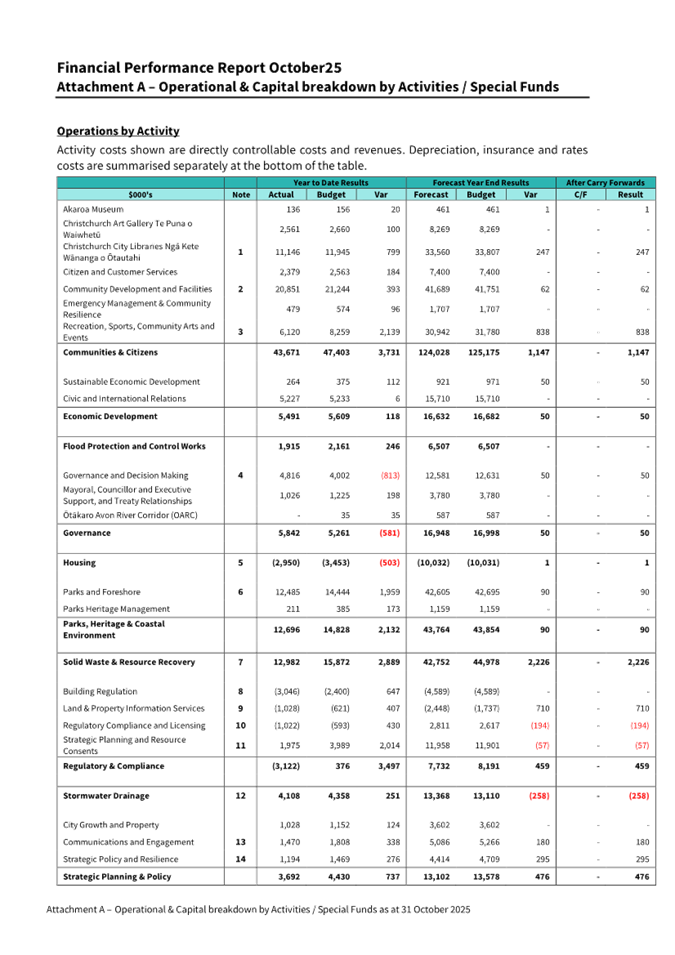
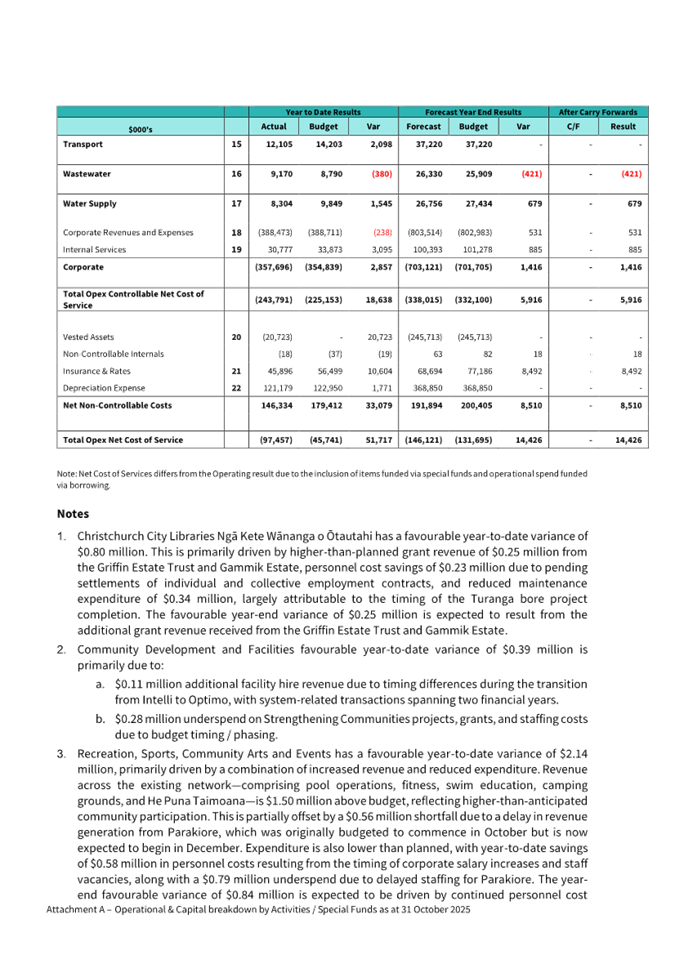
4. Operational Revenue and Expenditure
4.1 This
covers day to day spend on staffing, operations and maintenance, and revenues
to fund the operational spend.
4.2 Operational
revenue exceeds expenditure as it includes rates revenue for capital renewals
and debt repayment. This revenue is referred to below as ‘Funds not
available for Opex’ and is removed to show the year to date and forecast
cash operational surplus or deficit.
|
Year to Date Results
|
Forecast Year End Results
|
After Carry Forward
|
|
$m
|
Actual
|
Budget
|
Var
|
|
Forecast
|
Budget
|
Var
|
|
C/
fwd
|
Var
|
|
|
Operational
|
|
|
|
|
|
|
|
|
|
|
|
|
Revenues
|
(501.4)
|
(495.6)
|
5.8
|
|
(1,145.0)
|
(1,144.0)
|
1.0
|
|
-
|
1.0
|
|
|
Expenditure
|
304.7
|
327.7
|
23.0
|
|
878.1
|
891.6
|
13.5
|
|
-
|
13.5
|
|
|
Funds not
available for Opex
|
136.4
|
135.3
|
(1.1)
|
|
252.6
|
252.4
|
(0.2)
|
|
-
|
(0.2)
|
|
|
Operating
(Surplus)/Deficit
|
(60.3)
|
(32.6)
|
27.7
|

|
(14.3)
|
-
|
14.3
|
|
-
|
14.3
|
|
4.3 After
four months the year to date operating surplus variance is $27.7m and forecast
to reduce to $14.3m by financial year end. Summaries of the material revenue
and expenditure variances and changes are highlighted below.
4.4 Revenue
is $5.8m over budget year to date and forecast
to be $1.0m over budget at year end. Due to the large amount of corporate
revenues within Council’s budget, for which timing is well established,
actuals are tracking closely to budget, with less than a 0.1% favourable
variance forecast.
4.5 Key
drivers of actual and forecast revenue variances to budget include (amounts in
() are unfavourable variances, i.e. revenues below budget):
|
Revenue Variances
|
Annual Budget
|
YTD
Var
|
Forecast Var
|
|
Building & Planning consent volumes
(see cost variances)
|
37.2m
|
2.6m
|
-
|
|
Transport – NZTA, parking &
commercial rent
|
48.0m
|
1.1m
|
-
|
|
Recreation & Sports pools and
fitness centres increased participation
|
26.2m
|
0.9m
|
0.2m
|
|
Local Water Done Well transitional
funding
|
-
|
0.8m
|
-
|
|
Rates penalties
|
5.5m
|
0.7m
|
0.3m
|
|
Rates – additional late growth
|
825.7m
|
0.6m
|
0.6m
|
|
LIM & Property File volumes
|
3.3m
|
0.4m
|
0.7m
|
|
Transwaste dividend
|
5.6m
|
0.1m
|
(0.2m)
|
|
Water Billing and Trade Waste revenue
|
13.2m
|
(0.7m)
|
-
|
|
Resource Recovery transfer stations,
organics processing and landfills
|
24.4m
|
(0.9m)
|
(0.8m)
|
|
Other revenues
|
154.9m
|
0.2m
|
0.2m
|
|
Total
|
1,144m
|
5.8m
|
1.0m
|
4.6 Expenditure
is $23.0m under budget year to date and forecast to be $13.5m (1.5%) under
budget, after carry forwards, at year end.
4.7 Key
drivers of actual and forecast expenditure variances to budget include (amounts
in () are unfavourable variances, i.e. expenses are greater than budget):
|
Expenditure Variance
|
Annual Budget
|
YTD
Var
|
Forecast Var
|
|
Insurance costs
|
37.3m
|
9.9m
|
7.2m
|
|
Personnel costs (units with vacancies which were
planned to be filled)
|
292.4m
|
5.2m
|
2.6m
|
|
Waste Management lower recycling
processing fees and organic processing fees, and landfill costs
|
67.7m
|
3.8m
|
3.0m
|
|
Three Waters – timing of reactive maintenance
and operating costs
|
55.4m
|
2.8m
|
0.3m
|
|
Parks – timing of activity (pre-Spring) and no
major fire or flooding events
|
20.7m
|
1.4m
|
-
|
|
Rates on Council owned properties
|
39.9m
|
1.1m
|
1.7m
|
|
Digital – timing of software
renewals and portfolio delivery
|
35.0m
|
1.0m
|
-
|
|
Transport – timing of maintenance costs
|
67.7m
|
0.4m
|
(0.6m)
|
|
Riskpool insurance call
|
-
|
(0.4m)
|
(0.4m)
|
|
Governance – timing of remaining election
costs vs budget phasing
|
6.5m
|
(0.9m)
|
-
|
|
Other minor variances
|
269.0m
|
(1.3m)
|
(0.3m)
|
|
Total
|
891.6m
|
23.0m
|
13.5m
|
4.8 Operational
variances and explanations by Activity are shown in Attachment A.
5. Capital Expenditure and Revenue
5.1 This
section covers the capital programme spend and funding relating to it (details
on the delivery of capital projects is contained in the Capital Programme
Performance Report).
|
Year to Date Results
|
Forecast Year End Results
|
After Carry Forwards
|
|
$m
|
Actual
|
Budget
|
Var
|
|
Forecast
|
Budget
|
Var
|
|
Carry Fwd
|
Var
|
|
|
Core Programme
|
125.9
|
164.5
|
38.6
|
|
516.6
|
561.2
|
44.6
|
|
29.5
|
15.1
|
|
|
Less unidentified
Carry Forwards
|
-
|
-
|
-
|
|
(16.6)
|
-
|
16.6
|
|
31.7
|
(15.1)
|
|
|
Core Programme
|
125.9
|
164.5
|
38.6
|
|
500.0
|
561.2
|
61.2
|

|
61.2
|
-
|
|
|
One New Zealand
Stadium at Te Kaha
|
39.2
|
38.1
|
(1.1)
|
|
82.3
|
92.5
|
10.2
|
|
10.2
|
-
|
|
|
Total Capital
Programme
|
165.1
|
202.6
|
37.5
|
|
582.3
|
653.7
|
71.4
|

|
71.4
|
-
|
|
|
Revenues and
Funding
|
(124.3)
|
(143.7)
|
(19.4)
|
|
(310.4)
|
(310.4)
|
-
|
|
-
|
-
|
|
|
Borrowing
required
|
40.8
|
58.9
|
18.1
|
|
271.9
|
343.3
|
71.4
|
|
71.4
|
-
|
|
Capital
Expenditure
5.2 Capital expenditure is
$37.5m under budget year to date primarily due to Transport ($11.5m) and Three
Waters ($17.3m)
5.3 The
PMO’s current core programme year end forecast is $500m. This is $61.2m
(11%) lower than budget, most of which will likely be
requested to be carried forward to future years. The project managers’
forecast is currently $16.6m higher than PMO’s at $516.6m. The
primary reason for the variance is that the project managers forecast on a
project-by-project basis. In contrast the PMO forecasts using a programme
level analytical review and historic delivery trends of prior years.
5.4 The
project managers core programme end of year forecast is $44.6m (8%) under
budget before carry forwards due to underspends on three waters ($23.7m, 10% of
its total capex) and mainly related to delays arising from dependencies on
other project work proceeding, transport ($13.5m, 9% of its total capex) and
landfill and transfer station projects ($4.5m, 68% of its total capex).
Capital Revenues and Funding
5.5 Capital revenues and funding is $19.4m lower than budget year to
date. This is largely due to the timing of New Zealand Transport Agency capex
payments ($9.4m) and the reversal of year end shovel ready accruals
($5.8m). The balance relates to timing for Parakiore and Court Theatre
funding and reserve drawdowns.
5.6 Capital
revenues and funding are forecast to align with budget by year end.
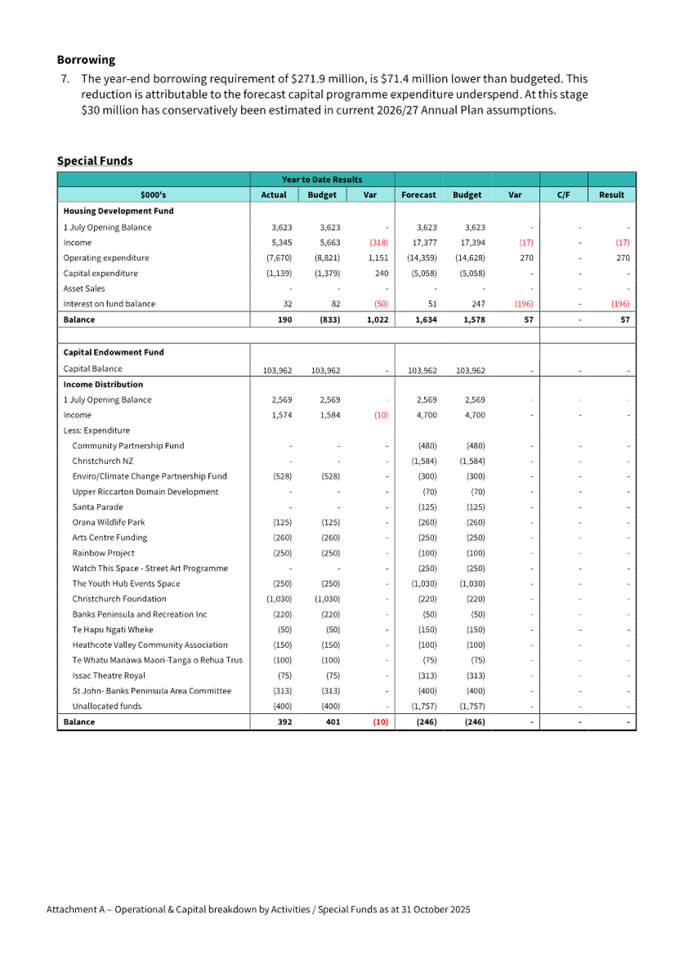
6. Special Funds
6.1 The
annual movements and balance of the Housing Account and Capital Endowment Fund
are shown in Attachment A (page 6).
6.2 The balance of funds
available, in the current financial year, for allocation from the Capital
Endowment Fund is $1,5m.
7. Treasury
Policy Compliance
7.1 Most
Council debt is incurred to fund capital expenditure (capex). Council may
also borrow and on-lend to related parties, to reduce overall Group interest
costs. Policy parameters are designed to manage Treasury risks in a
prudent and non-speculative manner, and to achieve an acceptable balance
between low costs and low volatility of costs from one year to the next (noting
that 22.3% of each year’s rates revenue
is spent on debt servicing). Current compliance with the four major
policy risk areas is tabulated below:
|
Policy Risk Area
|
Compliance
|
Plain-language meaning
|
|
Liquidity Risk
|
Yes
|
(cash availability)
|
|
Funding Risk
|
Yes
|
(spread of debt maturities)
|
|
Interest Rate Risk
|
Yes
|
(managing interest costs)
|
|
Counterparty Credit Risk
|
Yes
|
(not all eggs in one basket)
|
Borrowing
7.2 Total
gross debt is shown below – the current balance, projected for year end
June 26, and a comparison to last year-end (all figures are $ millions):
|
|
Jun-25 Actual
|
Current
|
Jun-26 Projected
|
Full Year Change
|
|
Ratepayer-funded
Debt
To fund Advances
to Related Parties
|
2,131
702
|
2,234
692
|
2,384
522
|
253
-180
|
|
Gross
Borrowing
|
2,833
|
2,926
|
2,906
|
73
|
7.3 Advances
to related parties are primarily to Christchurch City Holdings Ltd (CCHL),
currently $594.4m (which has reduced by $10m year to date).
7.3.1 Advances
to CCHL will steadily decline to zero by 2032, as existing advances mature and
CCHL funds it debt independently of Council.
7.3.2 Interest
earned on advances fully off-sets the related borrowing costs – there is
no additional interest rate risk for Council.
7.3.3 The
table excludes cash and other financial investments, which can be significant
and are held for working capital purposes.
Funding &
interest rate risks
7.4 Funding
risk is the risk that Council cannot access sufficient and/or
cost-effective borrowing when needed. The chart below shows how much of
Council’s existing debt matures in each financial year (green), plus the
amount of planned debt increase in each year (grey) – the combined total
shows how much needs to be sourced from debt markets each year.
7.4.1 The
green bars exclude amounts borrowed and on-lent to CCHL, because these will be
repaid by CCHL as they mature (i.e. the funding risk is managed by CCHL, not
Council).
7.4.2 Existing
debt is spread over a long period (out to November 2036), and the borrowing
requirement each year is considered comfortable.
7.5 Interest
rate risk is the risk that Council’s average cost of funding is
unacceptably high and/or volatile. Interest rate risk and funding risk
are managed independently – in practice, debt is normally incurred at a
“floating” rate, with interest rates managed separately using
derivative hedging instruments.
7.5.1 Most
existing Council debt has been fixed for at least the next three years, which
will limit the impact of market volatility on future borrowing costs.
7.5.2 Interest
expense budgets include the impact of anticipated changes to market interest
rates, so changes to headline figures such as the official cash rate do not
normally result in significant variances between actual and budgeted interest
expenses.
7.5.3 Council’s
average cost of funding for last year (actual), and the next three years
(projected) is presented in the table below:
|
|
Jun-25
|
Jun-26
|
Jun-27
|
Jun-28
|
|
Ratepayer-funded
Debt
|
4.9%
|
4.8%
|
4.8%
|
4.9%
|
7.6 For context, Council’s
average funding cost was 5.2% in 2018/19 (pre-Covid), and the long-term
planning assumption is around 4.9%-5.0%.
8. Rates Debt
8.1 Rates
debt decreased $1.8 million in the October 2025 quarter, as shown in the table
below. Rates debt is $2.0 million higher than October 2024.
|
$m
|
1 July 2025
|
Oct 2025
|
Change
|
Comment
|
|
Rates Debt
|
31.0
|
29.2
|
(1.8)
|
Total rates debt has remained stable this quarter.
|
|
Current year overdue
|
|
16.0
|
(16)
|
The change in the split of arrears.
|
|
Previous years arrears
|
31.0
|
13.2
|
17.8
|
is due to the change in rating year.
|
|
No. properties with arrears over $20,000
|
62
|
70
|
8
|
Rates penalties added to outstanding rates.
|
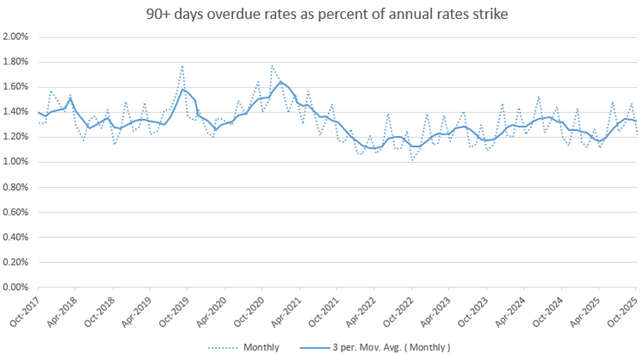
8.2 The
graph below shows 90+ day rates debt as a percentage of the annual rates strike
for each respective year, using a three-month moving average to smooth the
quarterly cycle. The graph also provides the trend in the management of rate
arrears over time. Generally, as a percentage of total rates, debt
remains relatively stable over the last one - two years and has trended down
modestly from what it was four - five years ago.
9. General Debt
9.1 There
has been a decrease in overdue debt in the last 4 months as outstanding
disputes continue to be resolved. This also reflects that invoices and issues
are being addressed in a timely manner.
|
$m
|
June
2025
|
October 2025
|
Change
Comment
|
|
General Debt
|
15.4
|
7.8
|
-7.6
|
|
|
3 – 6 months
|
0.2
|
0.2
|
0.0
|
|
|
6 months +
|
1.2
|
0.9
|
-0.3
|
|
9.2 General
debt of $62,870 has been written off this quarter ($29,743 relates to write-off
of debt for damaged traffic poles).
10. Insurance Claims
10.1 The
table below outlines the number of events that have been notified by Council
against its insurance policies as well as claims against Council from third
parties for the July – September 2025 period. Any significant claims are
reported to the Audit and Risk Management Committee by the Legal Services team.
|
Policy
|
Claims / Notifications
|
Estimated Cost
|
|
Above excess
|
Below excess
|
|
Claims
by Council
|
Motor
Vehicle
|
0
|
8
|
$8,500
|
|
|
Material
damage
|
0
|
0
|
$0
|
|
Claims
against Council
|
PI
/ PL
|
2
|
1
|
TBC
|
Attachments Ngā Tāpirihanga
|
No.
|
Title
|
Reference
|
Page
|
|
a ⇩
|
Attachment A
– Operational & Capital breakdown by activity - Oct 25
|
25/2333124
|
61
|
In addition to the attached documents, the following background
information is available:
|
Document
Name – Location / File Link
|
|
Not
applicable
|
Signatories Ngā Kaiwaitohu
|
Authors
|
Mitchell Shaw
- Principal Advisor - Finance
Karthik MG -
Reporting Accountant
Steve Ballard
- Group Treasurer
Martin Zelas -
Team Leader Rates Operations
Adrian Seagar
- Manager Insurance & Asset Management
Nick Dean -
Finance Business Partner
|
|
Approved By
|
Bede Carran -
General Manager Finance, Risk & Performance / Chief Financial Officer
|
|
8. Capital
Programme Performance Report October 2025
|
|
Reference Te Tohutoro:
|
25/2307450
|
|
Responsible Officer(s) Te Pou Matua:
|
Paul
Dadson - Senior Capital Programme Advisor Parks & Facilities
|
|
Accountable ELT Member Pouwhakarae:
|
Brent
Smith, General Manager City Infrastructure
|
1. Purpose and Origin of the Report Te Pūtake Pūrongo
1.1 The
purpose of this report is to present the Finance and Performance Committee with
the Capital Programme Performance Report for October
2025. This report provides Elected Members with oversight on the
performance of the Capital Programme.
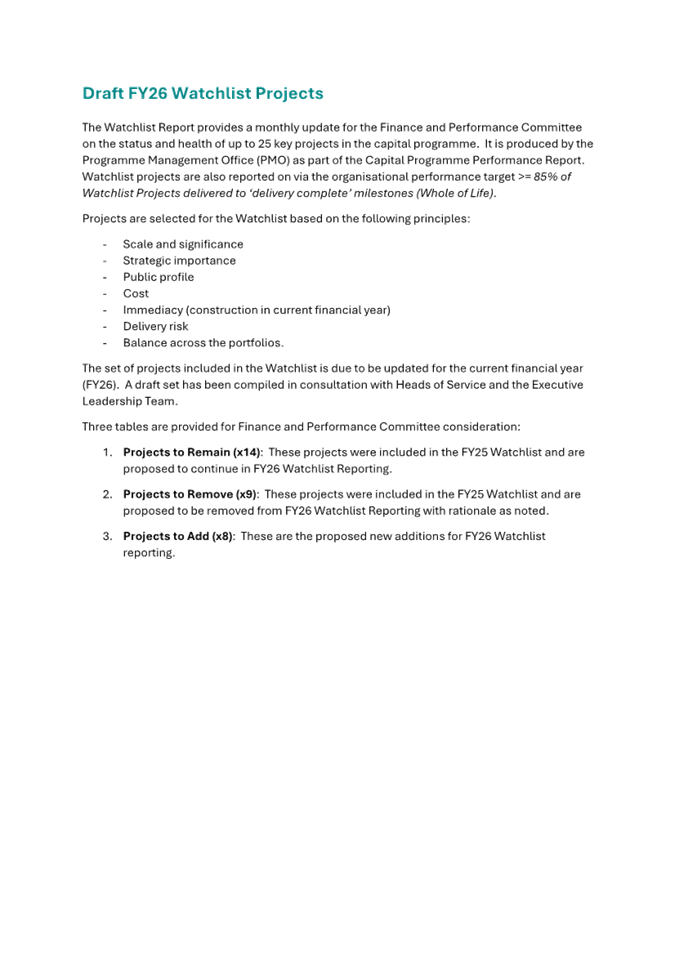
1.2 The
draft set of FY26 Watchlist projects is also submitted to the Finance and
Performance Committee for feedback and confirmation.
1.3 These
reports have been prepared by the Programme Management Office.
2. Officer Recommendations Ngā Tūtohu
That the Finance and
Performance Committee:
1. Receives the information in the Capital Programme Performance Report October
2025.
2. Confirms the draft set of FY26 Watchlist projects (as set out in Attachment
B).
3. Background/Context Te Horopaki
3.1 This
is the first monthly Capital Programme Performance Report for the Finance and
Performance Committee for the current Financial Year 2025/26 (FY26), following
the recent Elections period.
3.2 As
of October month-end, the FY26 year-end forecast for the overall capital
programme is $582.3m, or 89% of budget. This is based on the PMO
Forecast for CCC Capital, and the year-end forecast for One New Zealand Stadium
at Te Kaha.
3.3 For
CCC Capital (excluding One New Zealand Stadium at Te Kaha):
3.3.1 The PMO
Forecast for FY26 year-end is $500m, or 89% of budget, which is 5% lower
than the aggregated project management forecast of $525.3m.
3.3.2 Financial
year to date expenditure has been well aligned with monthly forecasts overall.
3.3.3 Current
FY26 year-end forecasts for major areas of CCC Capital range between 78% - 107%
of budget. Delivery in FY26 is strongly dependent on the two core
infrastructure areas - Three Waters and Transport - which together account for
71% of CCC Capital budget (44% and 27% respectively).
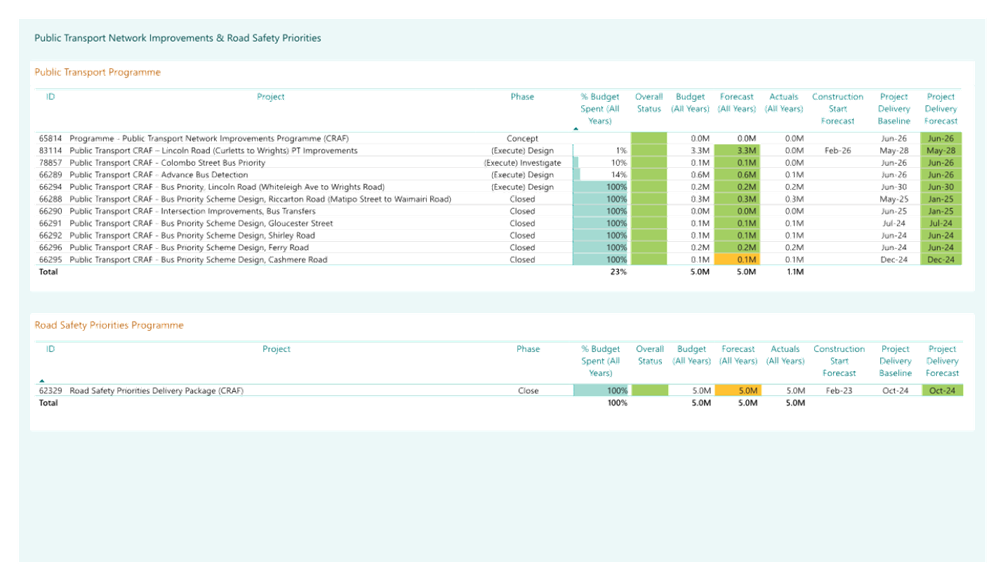
3.4 Full
results are provided in the Capital Programme Performance Report for October
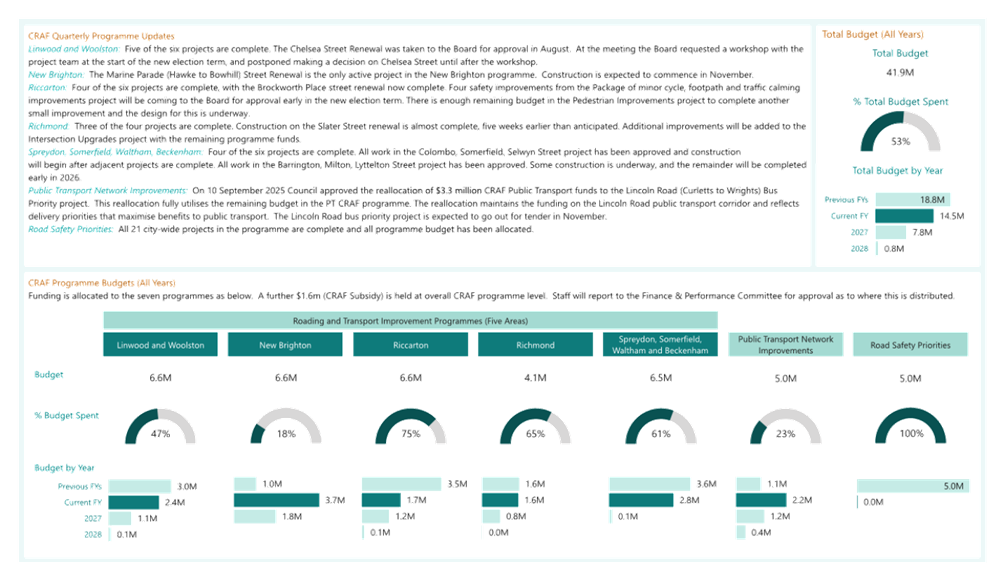
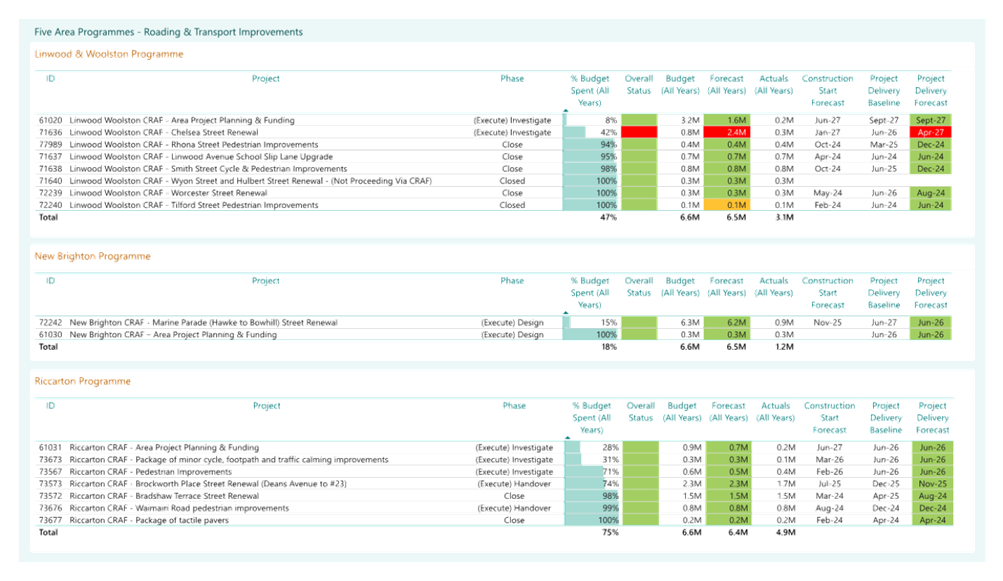
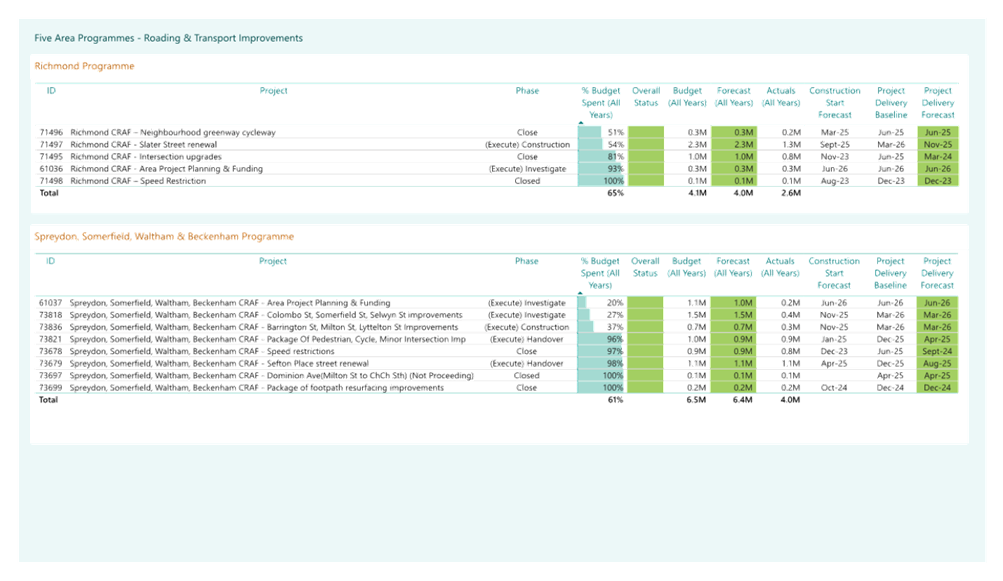
2025 (Attachment A). This includes the Watchlist Report as
Appendix 1, and the quarterly Transport Christchurch Regeneration Acceleration
Facility (CRAF) Report as Appendix 2.
3.5 Since
the prior Watchlist Report presented to the Finance and Performance Committee
(May 2025 month-end), the following updates have been made to the set of
Watchlist projects:
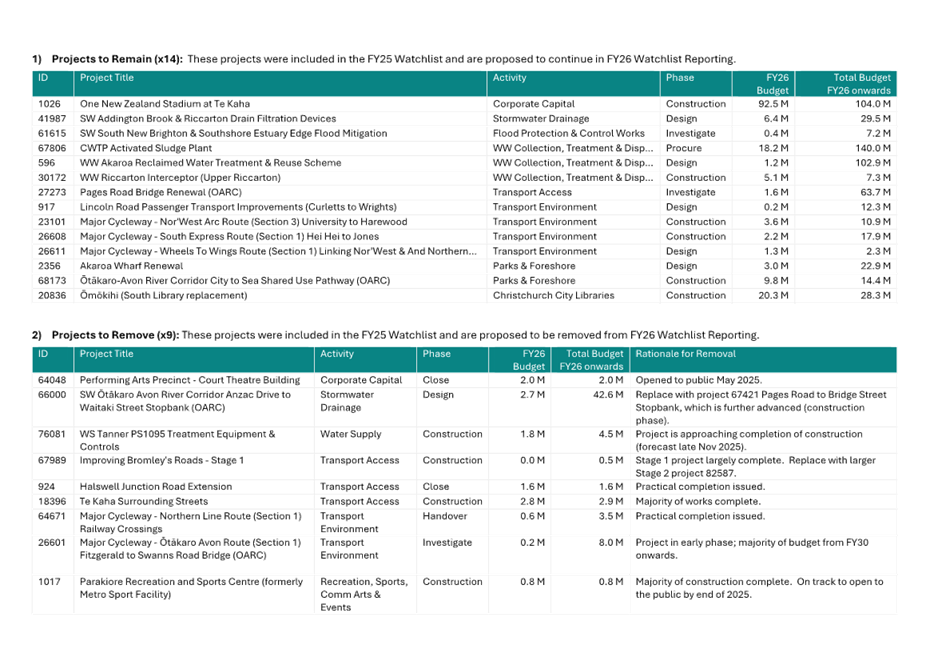
3.5.1 Three
late-stage projects have been retired from the Watchlist Report:
- 64048 - Performing Arts
Precinct - Court Theatre Building (open to the
public)
- 924 - Halswell Junction Road
Extension (practical completion issued)
- 64671 - Major Cycleway -
Northern Line Route (Section 1) Railway Crossings
(practical completion issued).
3.5.2 For
Improving Bromley's Roads, the Stage 1 project 67989 (which is
largely complete) has been replaced with the Stage 2 project 82587
(which is now underway).
3.6 Active
risks / issues affecting Watchlist projects include budget shortfalls and
risks, consenting timelines and uncertainty, some programme delays, third-party
interdependencies, contaminated land, and ground conditions.
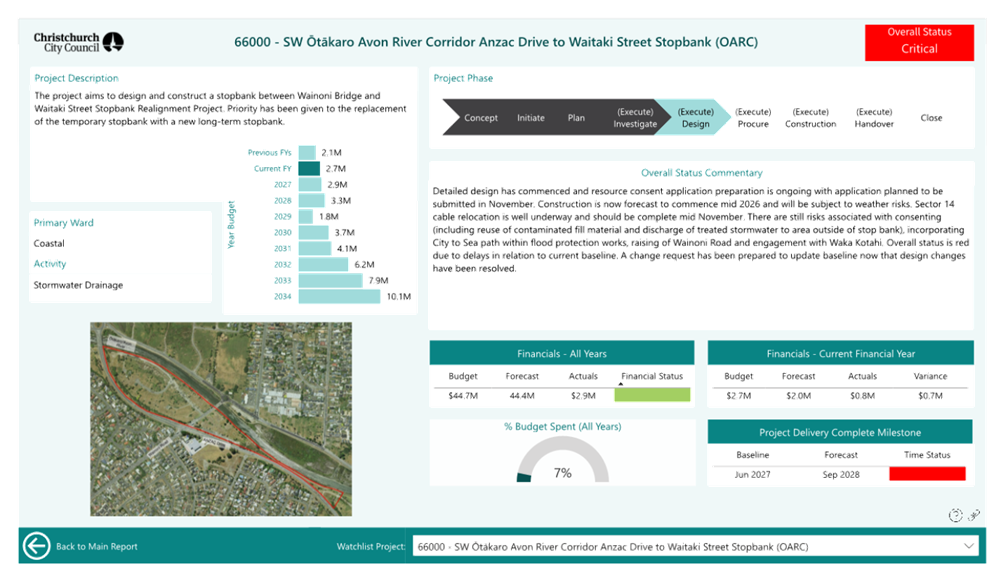
3.7 The
three Watchlist projects below have had a change in Overall Status flag since
the May 2025 month-end report, from ‘Amber – At Risk’ to
‘Red – Critical’:
- 66000 - SW Ōtākaro Avon River Corridor Anzac Drive to Waitaki Street Stopbank (OARC)
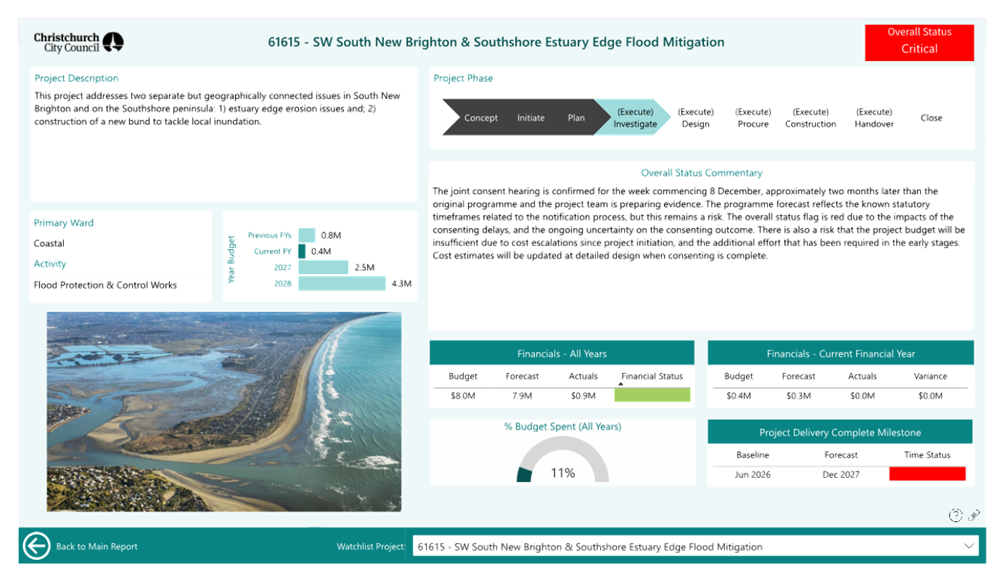
due to delays during the design phase
- 61615 - SW South New Brighton & Southshore Estuary Edge Flood Mitigation
due to consenting delays, and the ongoing
uncertainty on the consenting outcome
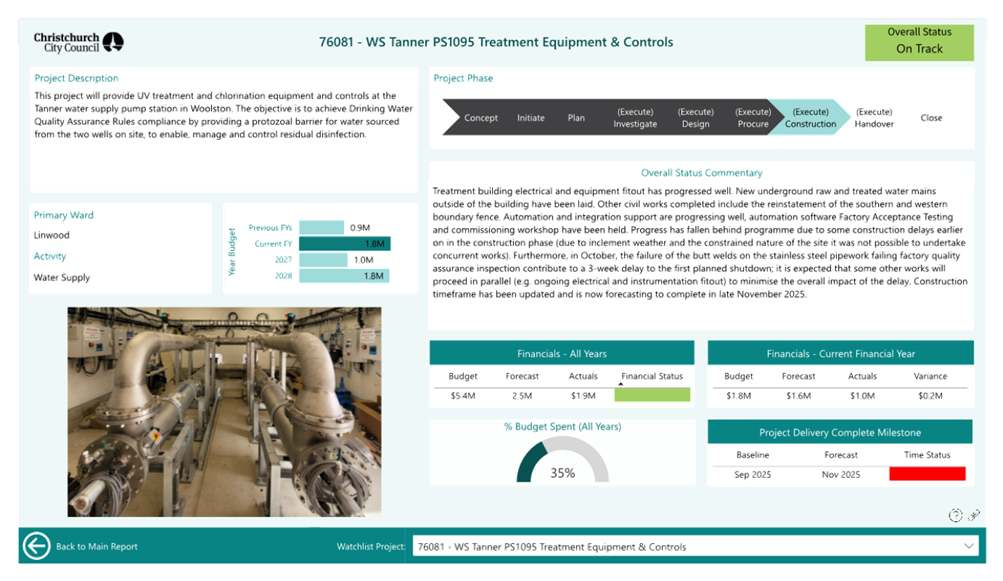
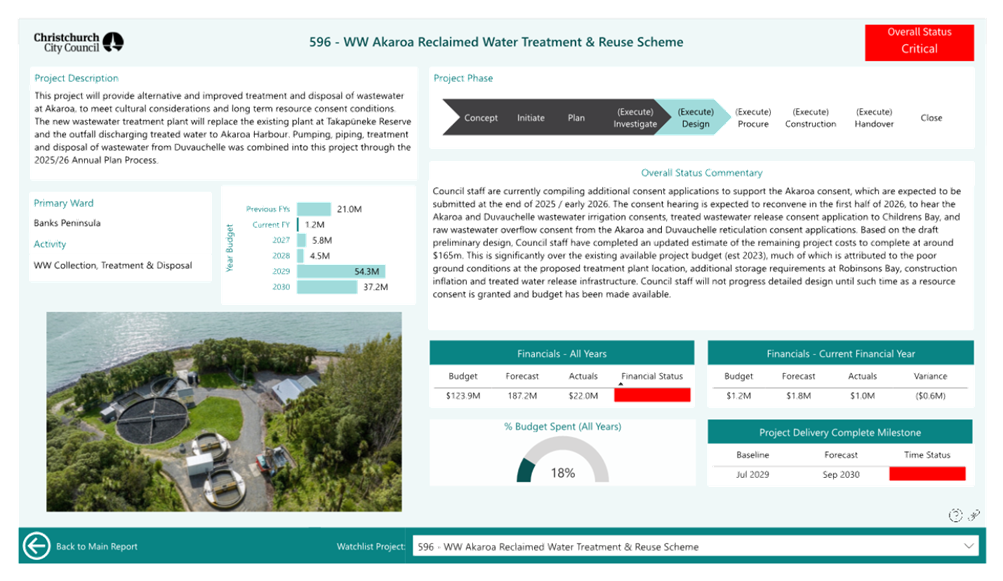
- 596 - WW Akaroa Reclaimed Water Treatment & Reuse Scheme
due to the updated cost estimates and budget
shortfall.
3.8 A
draft set of FY26 Watchlist projects has also been prepared in consultation
with Heads of Service for major areas of capital and the Executive Leadership
Team (Attachment B). The paper includes three tables for Finance and
Performance Committee feedback on any changes required and confirmation:
- 14 projects proposed to remain
in the Watchlist from last financial year
- 9 projects proposed for removal
from the Watchlist from last financial year
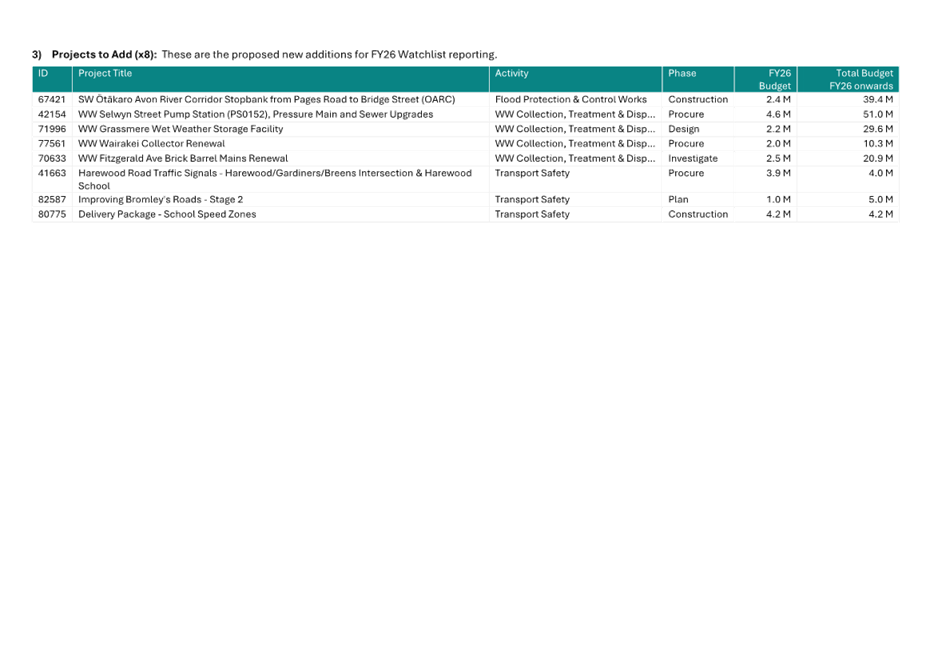
- 8 projects proposed to be newly
added to the Watchlist.
3.9 The
Monthly Change Report is included in the public
excluded section due to contract commercial sensitivity.
Attachments Ngā Tāpirihanga
|
No.
|
Title
|
Reference
|
Page
|
|
a ⇩
|
Capital
Programme Performance Report - October 2025 - Final
|
25/2318960
|
72
|
|
b ⇩
|
Proposed FY26
Watchlist Projects - Draft for Finance and Performance Committee
|
25/2317745
|
106
|
In addition to the attached documents, the following background
information is available:
|
Document
Name – Location / File Link
|
|
Not
applicable
|
Signatories Ngā Kaiwaitohu
|
Authors
|
Lauren Barry -
Senior PMO Business Analyst
Paul Dadson -
Senior Capital Programme Advisor Parks & Facilities
|
|
Approved By
|
Brent Smith -
General Manager City Infrastructure
|
|
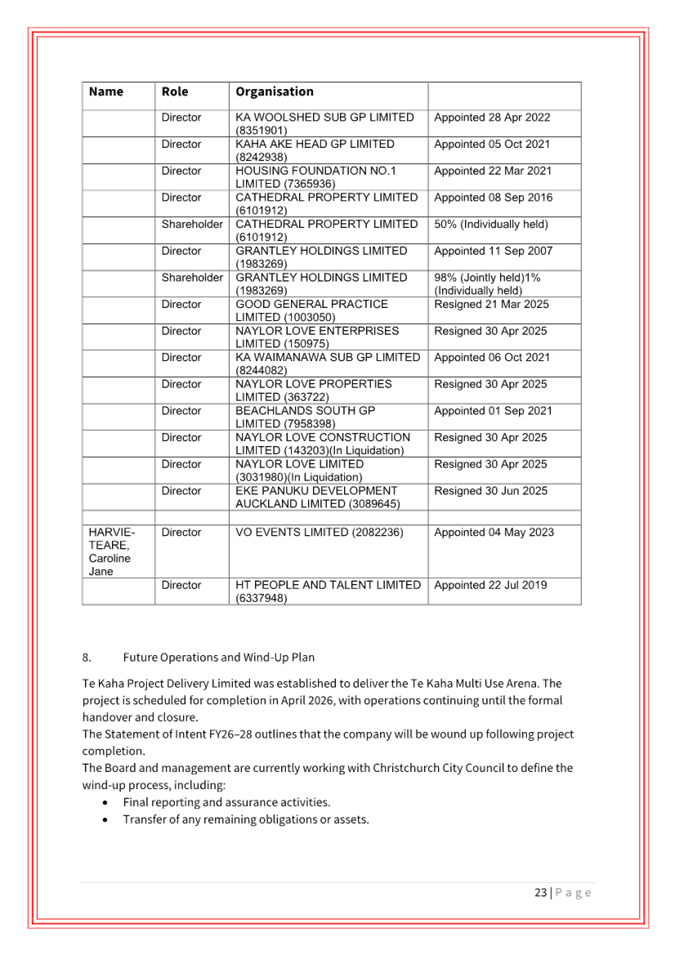
9. One
New Zealand Stadium at Te Kaha - Elected Members' Update
|
|
Reference Te Tohutoro:
|
25/2308919
|
|
Responsible Officer(s) Te Pou Matua:
|
David
Kennedy, Chief Executive Te Kaha Project Delivery Limited
|
|
Accountable ELT Member Pouwhakarae:
|
Andrew
Rutledge, General Manager Citizens and Community
|
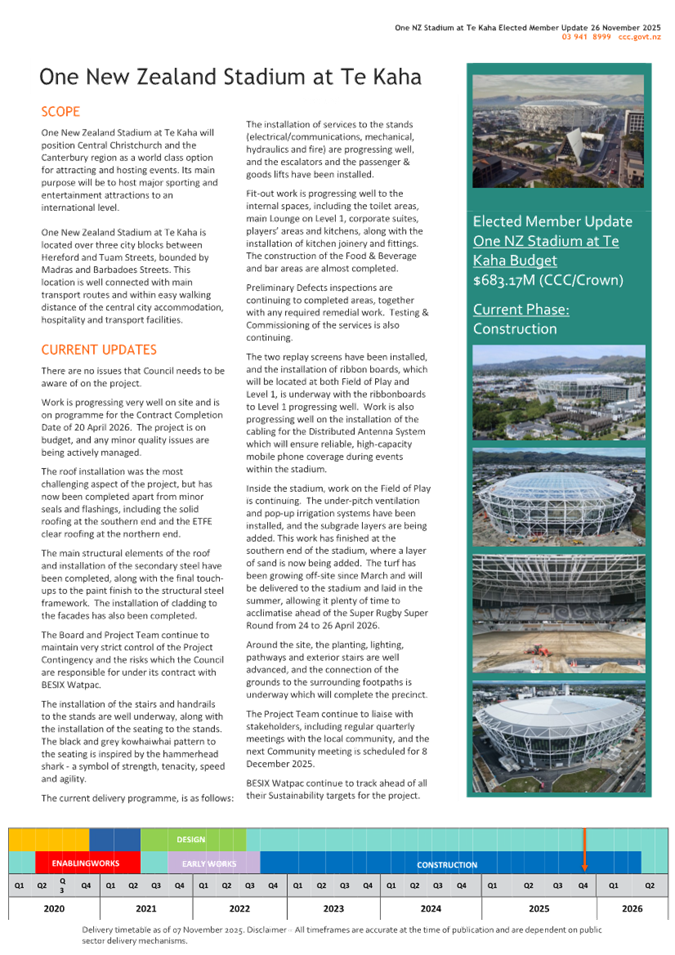
1. Purpose and Origin of the Report Te Pūtake Pūrongo
1.1 The
purpose of this report is to update elected members on the progress of the One
New Zealand Stadium at Te Kaha project.
2. Officer Recommendations Ngā Tūtohu
That the Finance and
Performance Committee:
1. Receives the information in the One New Zealand Stadium at Te Kaha - Elected
Members' Update Report.
Signatories Ngā Kaiwaitohu
|
Author
|
David Kennedy
- Chief Executive Te Kaha Project Delivery Limited
Mark Noonan
– Project Director
|
|
Approved By
|
Barry Bragg
– Chairperson, Te Kaha Project Delivery Limited
|
Attachments Ngā Tāpirihanga
|
No.
|
Title
|
Reference
|
Page
|
|
a ⇩
|
Attachment to
report 25/2308919 (Title: Te Kaha - 26 November 2025 Finance &
Performance Committee update report)
|
25/2308924
|
110
|
|
10. Christchurch City Holdings Ltd - Annual Report
2024/25
|
|
Reference Te Tohutoro:
|
25/1865337
|
|
Responsible Officer(s) Te Pou Matua:
|
Linda
Gibb, Performance Advisor, Finance
|
|
Accountable ELT Member Pouwhakarae:
|
Bede
Carran, General Manager Finance, Risk & Performance / Chief Financial
Officer
|
1. Purpose and Origin of the Report Te Pūtake Pūrongo
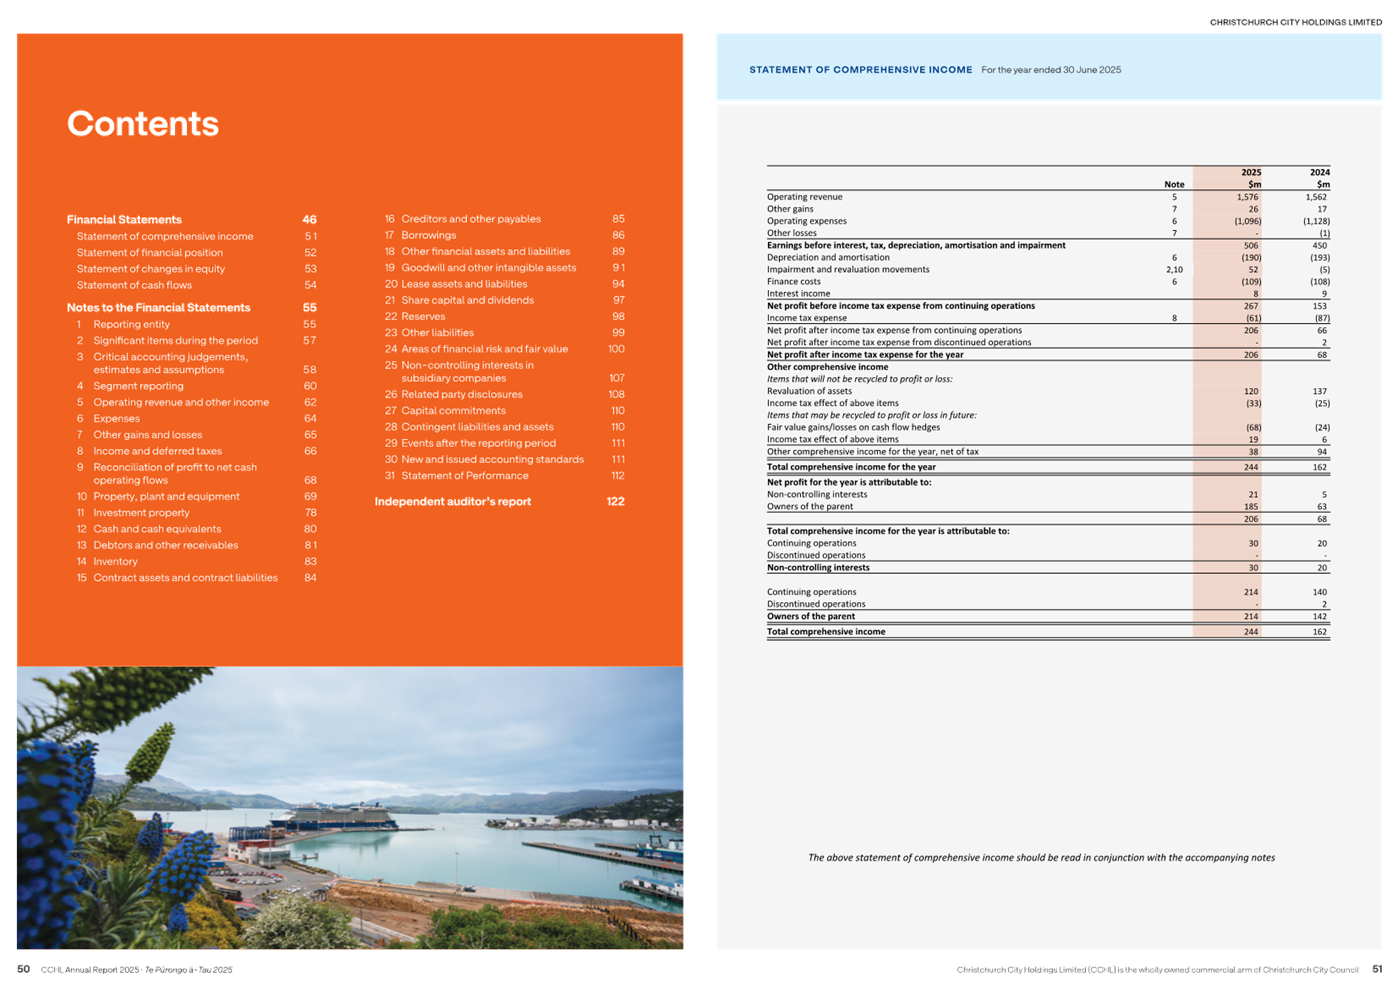
1.1 The purpose of
this report is to present Christchurch City Holdings Ltd’s (CCHL) Annual Report
and audited financial statements for the year ending 30 June 2025.
1.2 This report has been written following receiving CCHL’s Annual
Report on 30 September 2025, (refer Attachment A).
2. Officer Recommendations Ngā Tūtohu
That the Finance and
Performance Committee:
1. Receives Christchurch City Holdings Ltd -
Annual Report 2024/25.
3. Executive summary Te
Whakarāpopoto Matua
3.1 CCHL has submitted its Annual Report for the year ended 30 June
2025, meeting all statutory requirements under the Local Government Act 2002 (LGA)
and receiving an unqualified audit opinion. The report was delivered within the
required timeframe on 30 September 2025.
3.2 Financial
highlights include:
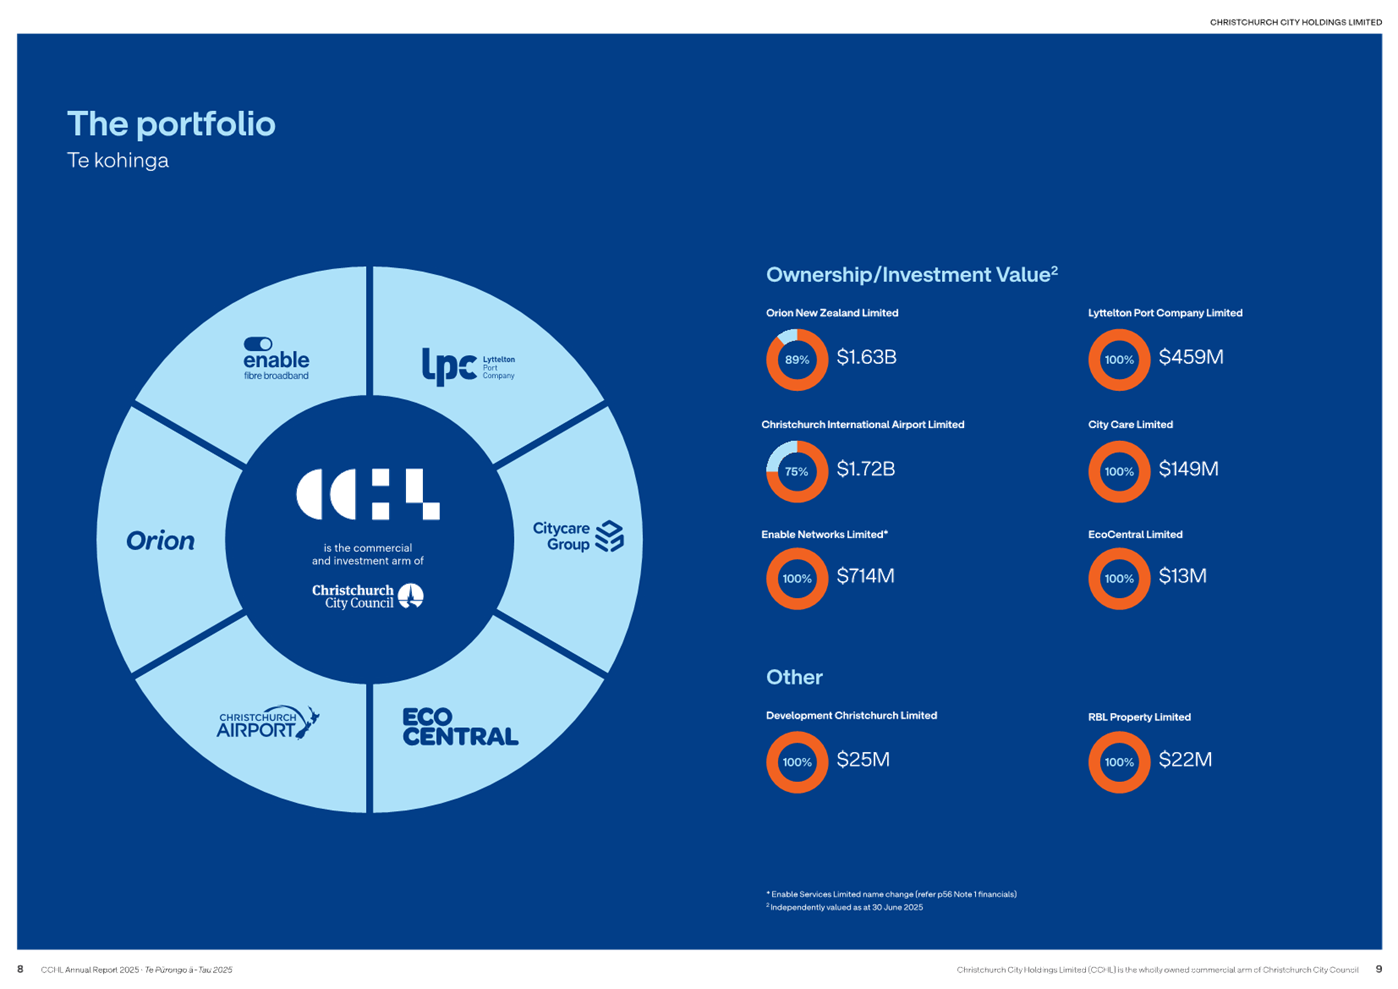
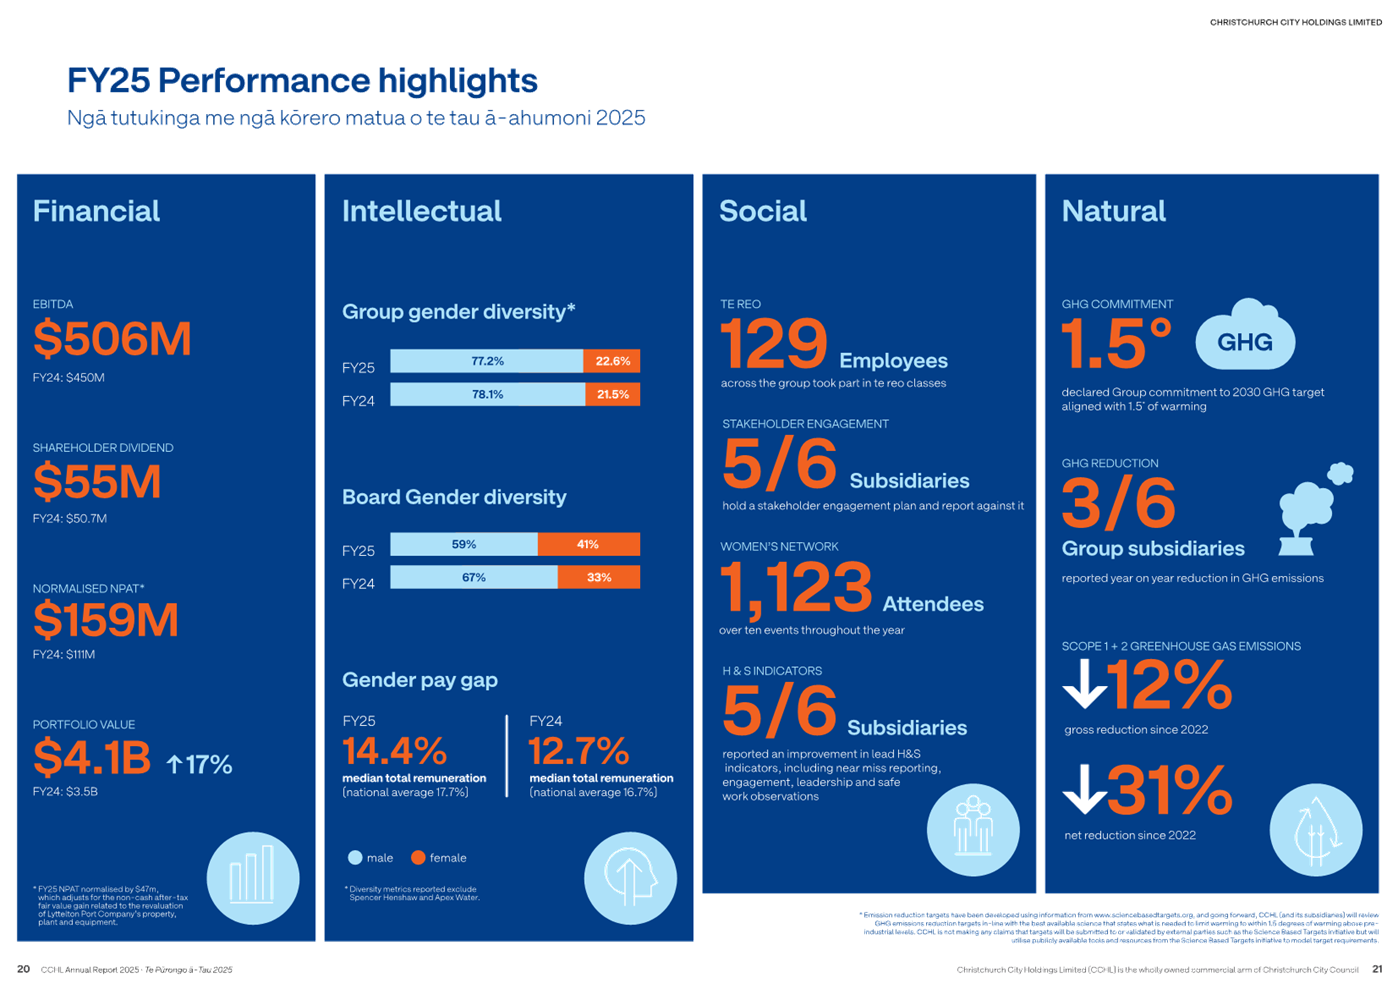
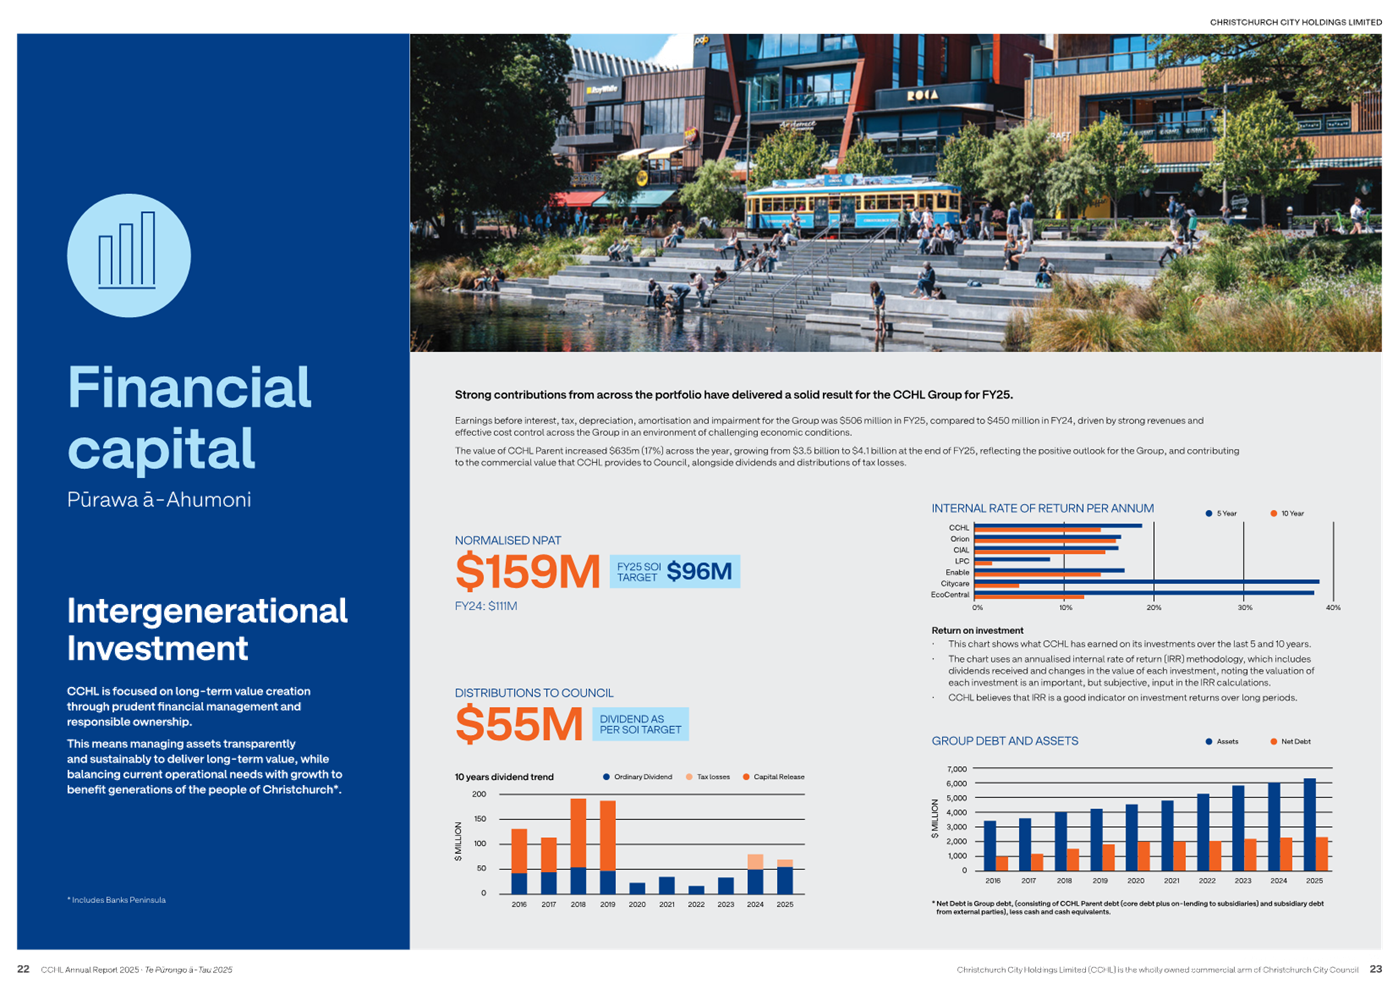
· Normalised net profit after tax (NPAT): $159m (vs $111m prior year;
Statement of Intent (SOI) target $96m)
· Dividends to Council: $55m (target met)
· Financial position continues to strengthen
· Performance exceeded targets, driven by strong results from Christchurch
International Airport Limited (CIAL), Orion New Zealand Limited (Orion), Enable
Networks Limited (Enable), and Lyttelton Port Company Limited (LPC).
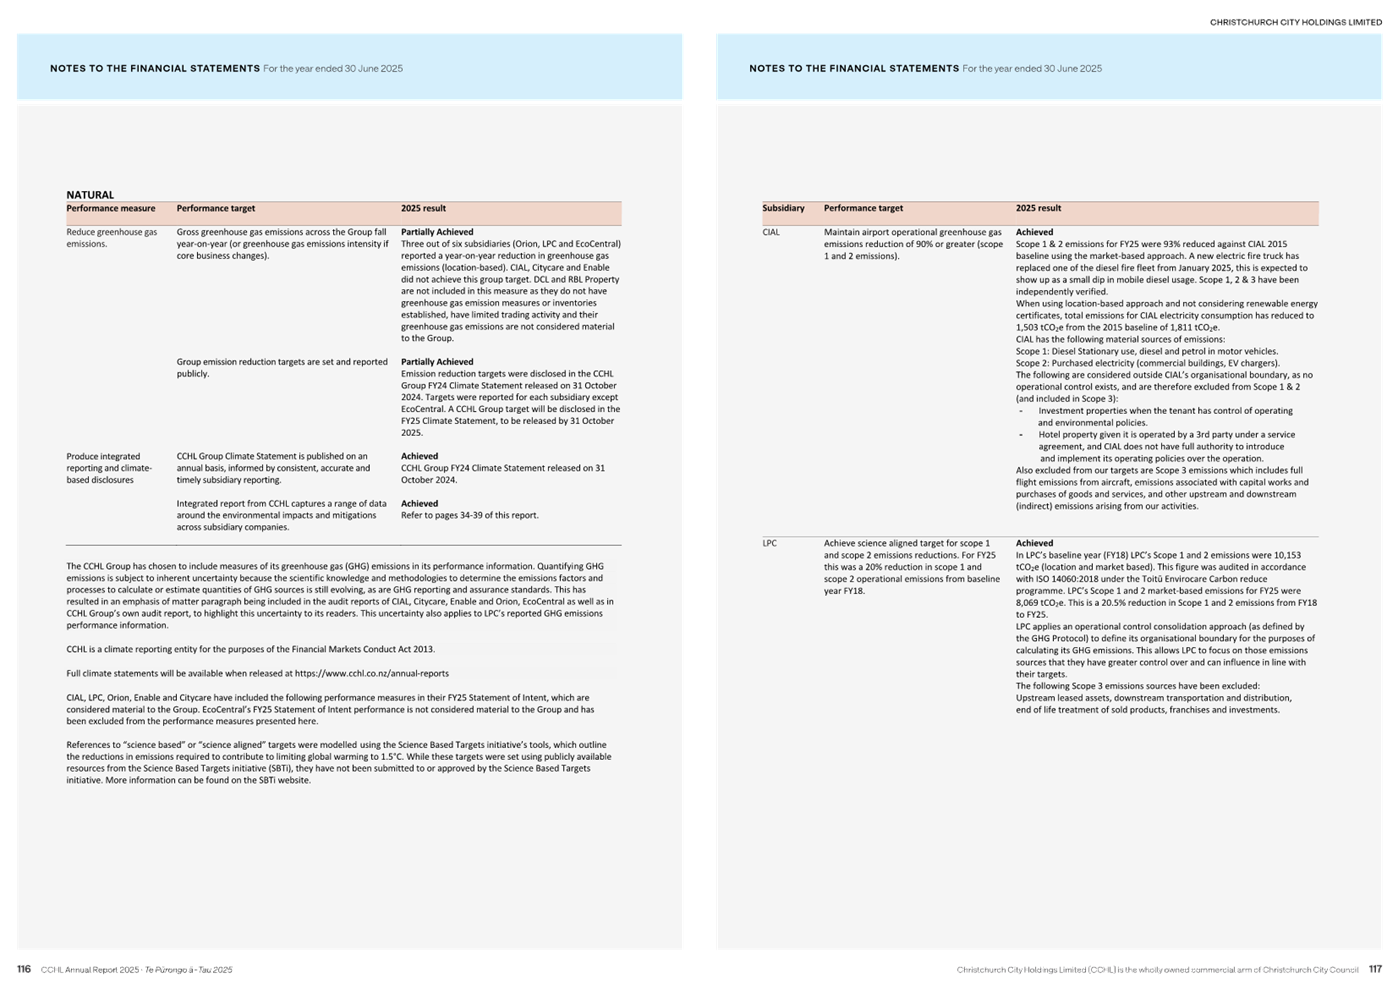
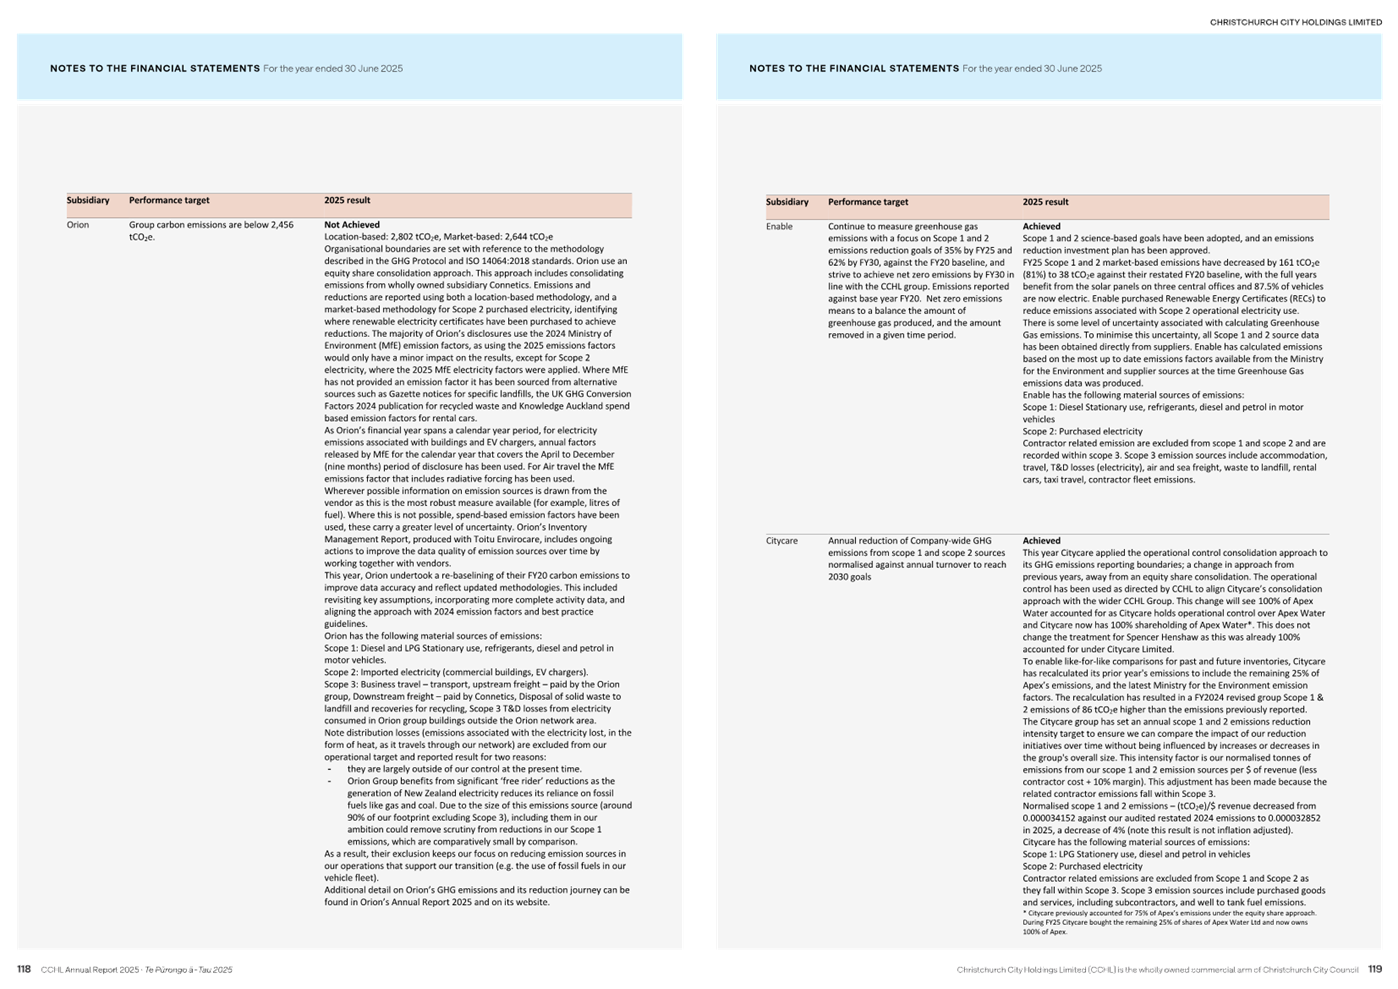
3.3 CCHL is a climate reporting entity and is required to produce
climate statements, in addition to its commitment to emissions reduction set
out in its SOI with Council. CCHL has recorded a 12% reduction in Scope 1
& 2 emissions since 2022. Most subsidiaries met climate targets,
noting that Orion, which did not, advises that it remains on track for its 2030
goal.
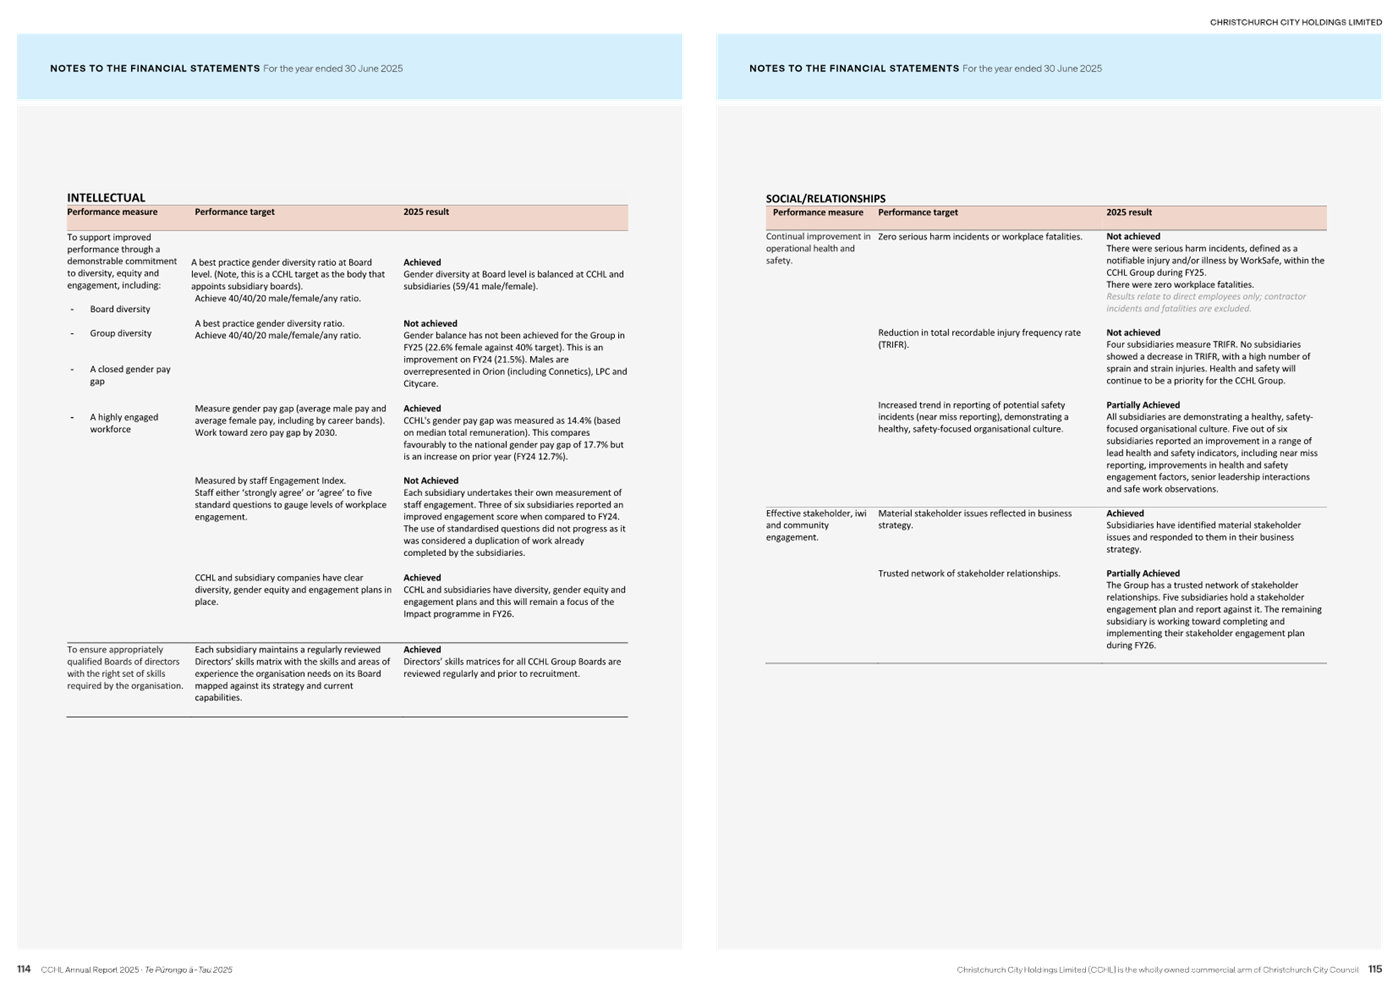
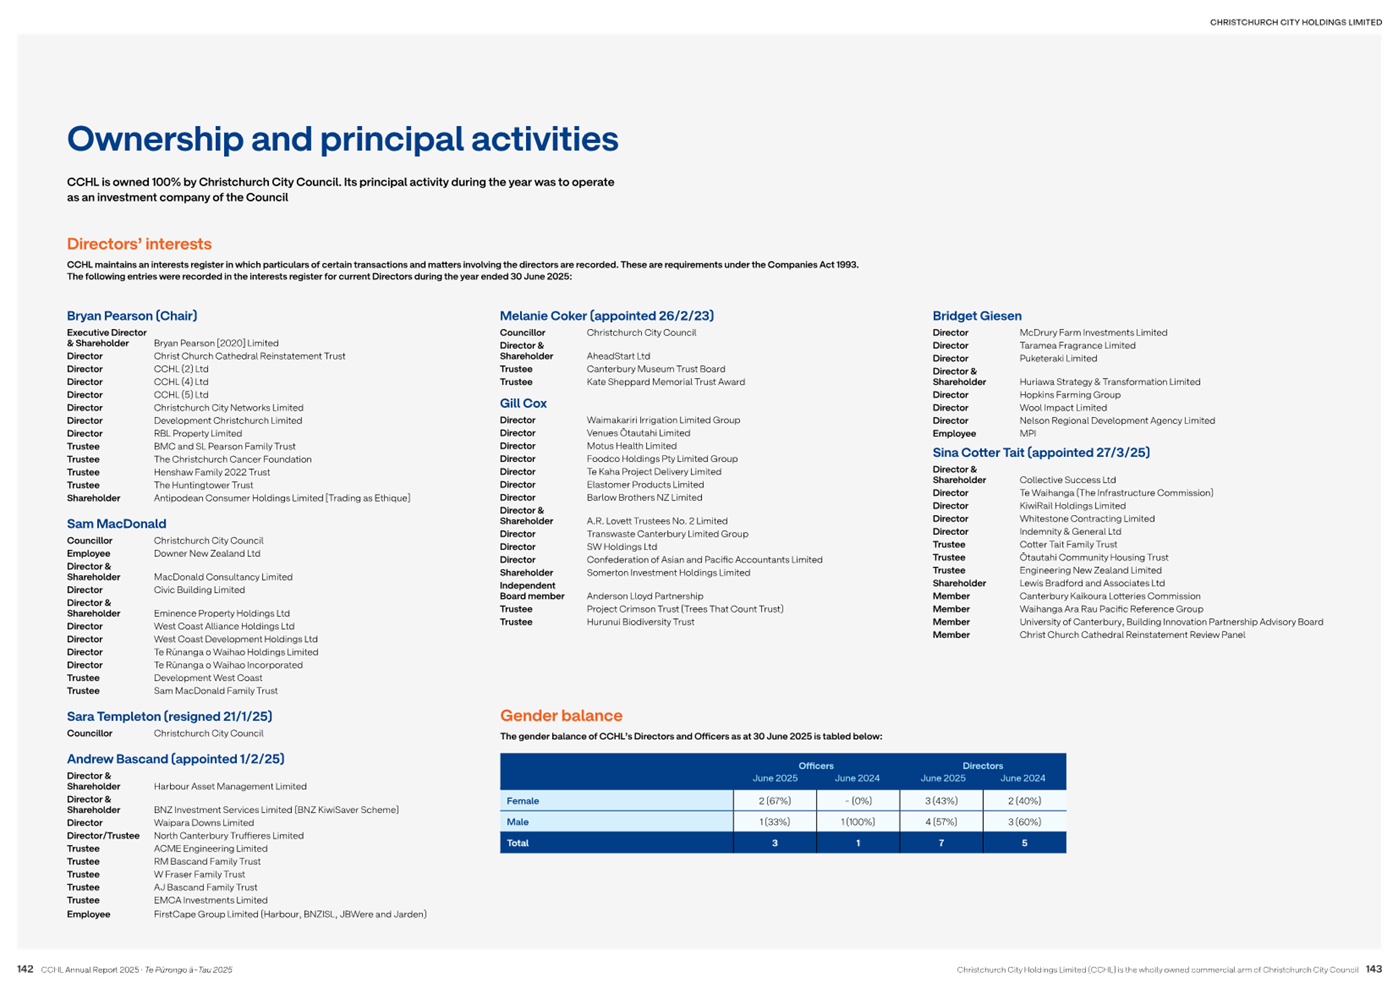
3.4 Some
SOI targets were not met, largely in respect to gender
diversity, gender pay gap, staff engagement, and health & safety (recorded
injury frequency rate and serious harm incidents). CCHL advises that improvement
plans are in place.
3.5 CCHL
will hold its Annual Meeting (AGM) on 28 November 2025 where further
information on it and the subsidiaries performance will be presented.
4. Background/Context Te Horopaki
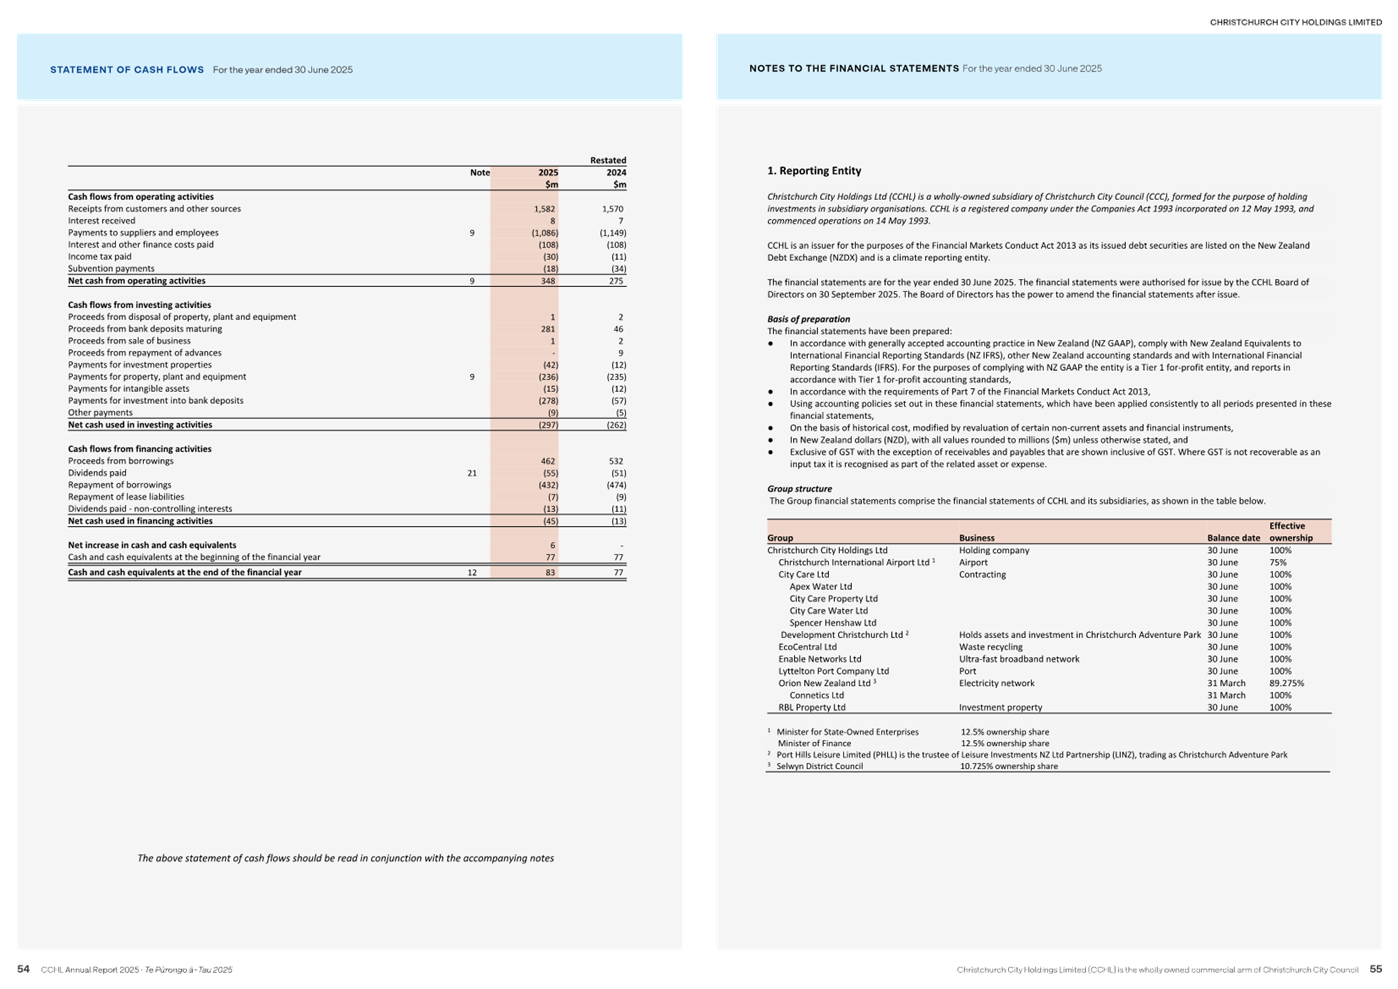
4.1 The CCHL group
comprises the following companies:
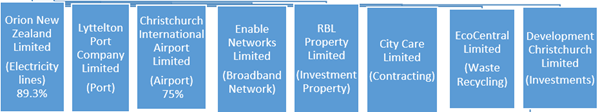
4.2 Section 67(1) of the Local Government Act 2002 (LGA) requires the board
of a CCO to submit an annual report to shareholders within three months of the
end of the financial year (by 30 September).
4.3 CCHL’s 2024/25 Annual Report complies with section 67(2) of
the LGA by including: a comparison of performance with the SOI, explanations of
material variances, and an auditor’s report on the financial statements
and performance measures (sections 68 and 69 of the LGA). CCHL
received an unmodified audit opinion, confirming the information in its
financial and performance statements is fairly presented.
4.4 CCHL also
provided its Full Year Results Announcement (unaudited) to the
NZX on 29 August 2025 as required by NZX Listing Rule 3.5.
5. Considerations
Ngā Whai Whakaaro
Profitability
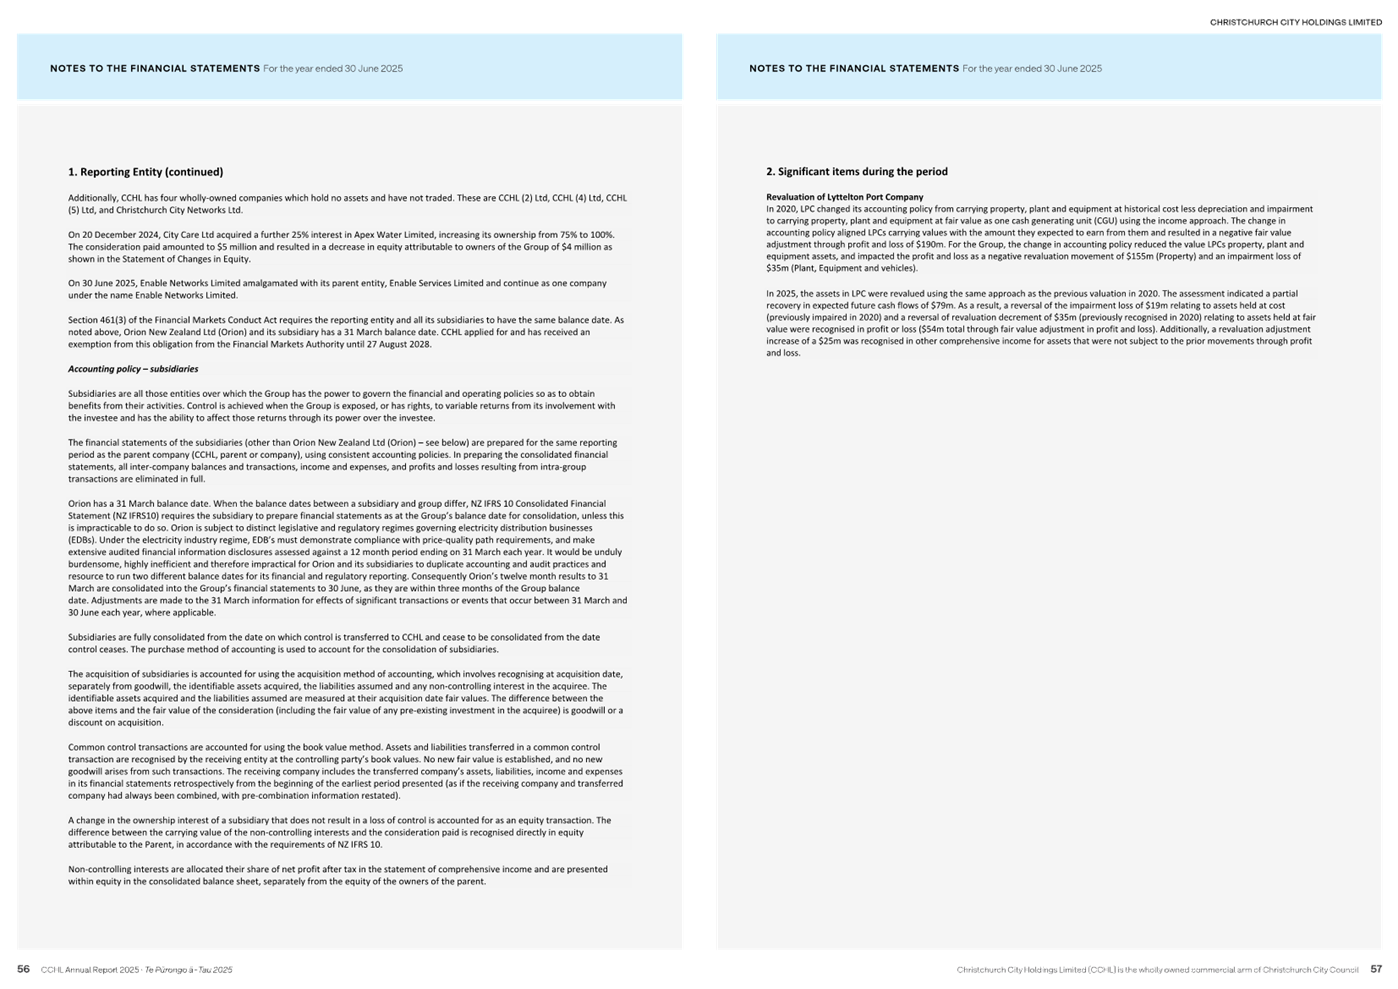
5.1 The CCHL group’s net profit after tax (NPAT) for the year was
$206 million (2024: $68 million). This includes a non-cash revaluation
uplift of $47 million relating to Lyttelton Port Ltd’s (LPC’s) property,
plant and equipment. To reflect operating profitability on a business as
usual basis and to enable meaningful comparisons against SOI targets and prior
periods, NPAT is normalised at $159 million ($206M - $47M).
5.2 In the prior year (FY2024), NPAT was $68 million which included a
$43 million non-cash expense reflecting the Government’s removal of
depreciation as a tax-deductible expense on commercial buildings.
Normalised NPAT for FY 2024 the CCHL group was $111 million ($68M + $43M).
5.3 The analysis in this report is based on normalised NPAT in both
years. A summary analysis is set out below.
5.4 The
table below reports the CCHL group’s normalised financial performance in
2024/25, compared with SOI targets and the prior year’s performance:
|
CCHL Group
|
2024/25
Actual
|
2024/25
SOI
target
|
Prior
Year Actual
|
|
|
$m
|
$m
|
$m
|
|
Normalised NPAT
|
159
|
96
|
111
|
|
Dividends to CCHL
|
95
|
-
|
93
|
|
Dividends to Council
|
55
|
55
|
51
|
|
Interest paid on group debt
|
108
|
-
|
108
|
|
Total Assets
|
6,314
|
-
|
6,029
|
|
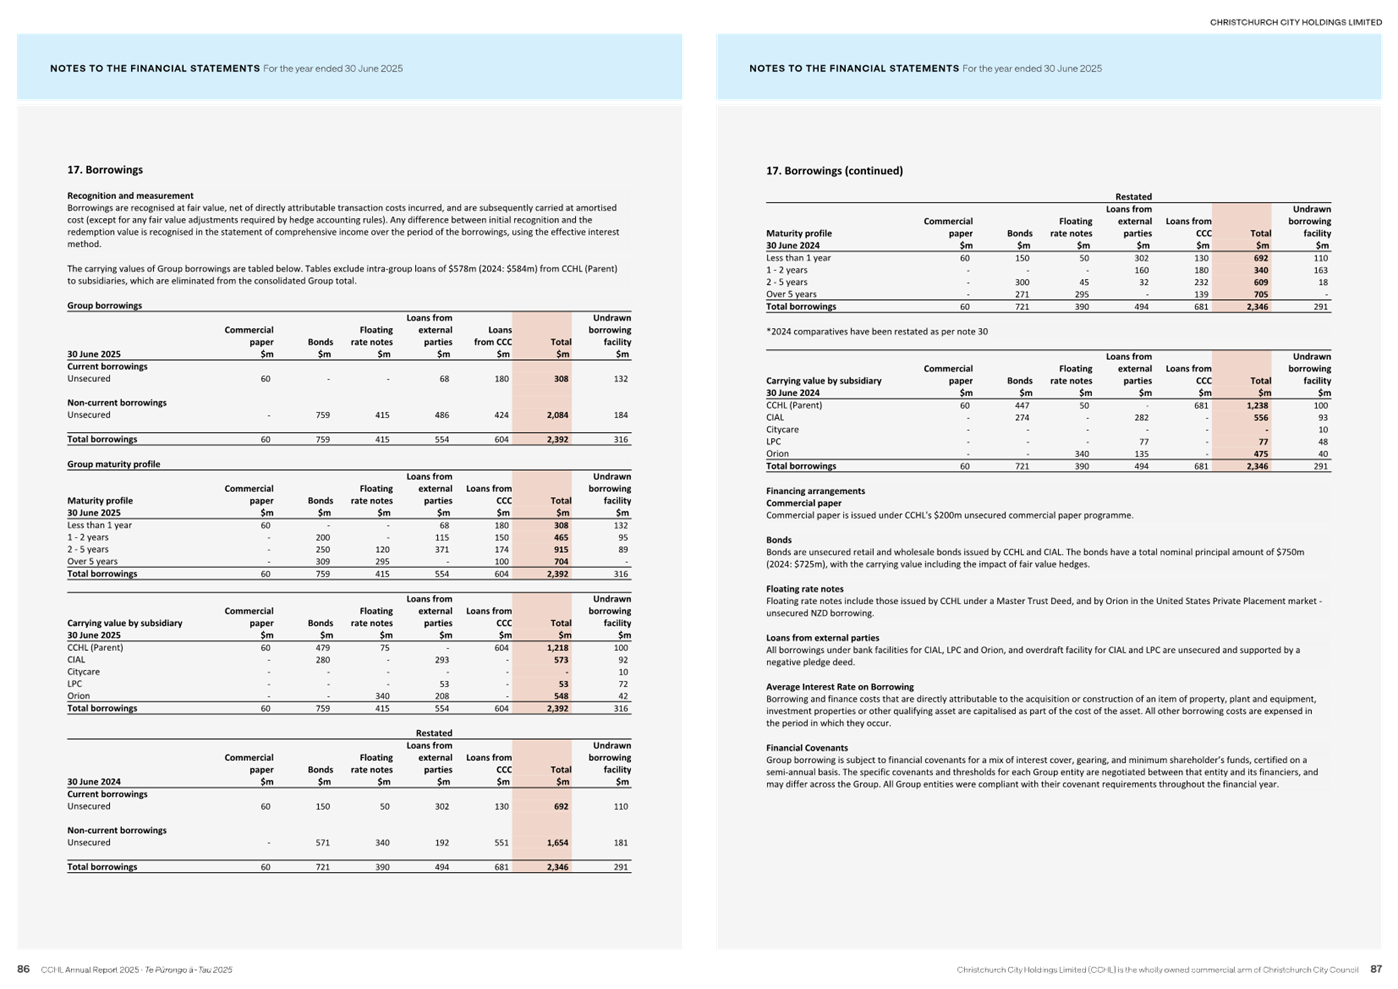
Debt
|
2,392
|
-
|
2,346
|
|
Gearing (debt: debt + equity)
|
44.9%
|
-
|
45.0%
|
|
Return on Equity (normalised)
|
5.6%
|
3.6%
|
2.5%
|
|
Shareholders Funds % Total Assets
|
46%
|
45%
|
46%
|
5.5 The
table above reflects CCHL’s dividend income from its subsidiary companies
is broadly applied to meeting its own operational costs of around $5 million,
debt servicing of approximately $56 million (note the above table shows
interest paid of $108 million which is on Group debt and includes Orion and
CIAL debt which they hold independently of CCHL, the servicing costs of which
are met by the companies prior to their dividends being made to CCHL) and
dividend distribution to the Council of $55 million.
5.6 Note
that while debt increased by $46 million across the group, interest costs held
at 2023/24 levels reflecting the reduction in rates between years.
5.7 The
contributions to normalised NPAT made by each of CCHL’s subsidiary
companies are shown in the following table:
|
Normalised NPAT*
|
2024/25
Actual
|
2024/25
SOI
target
|
Variance
|
Prior
Year Actual
|
Variance
|
|
$m
|
$m
|
$m
|
$m
|
$m
|
|
Orion
|
24
|
16
|
+8
|
17
|
+7
|
|
CIAL
|
75
|
49
|
+26
|
53
|
+22
|
|
LPC
|
25
|
23
|
+2
|
15
|
+10
|
|
Enable
|
41
|
35
|
+6
|
36
|
+5
|
|
City Care
|
13
|
12
|
+1
|
9
|
+4
|
|
EcoCentral
|
2
|
1
|
+1
|
3
|
-1
|
*The numbers in this table do not sum to the Group’s normalised
NPAT target due to the exclusion of the CCHL parent, other minor subsidiaries
and intragroup eliminations.
5.8 Against
target, normalised NPAT is higher by $63 million reflecting:
(i) CIAL (+$26 million)
which is a non-cash value increase of CIAL’s investment property
portfolio;
(ii) Orion (+$8 million) due to
a number of factors including lower network maintenance expenditure as a result
of fewer storms and higher demand for electricity due to colder Autumn 2024 as well
as higher capital contributions for future works;
(iii) Enable (+$6 million) from cost
control; and
(iv) Group transactions including
lower finance costs of $7 million.
5.9 Against
the prior year, normalised NPAT is higher by $47 million. As a
percentage of operating revenue, operating costs reduced across the group by
around 3.5%. Other material increases are attributable to:
(i) Orion (+$7 million)
from higher demand for electricity in Autumn 2024 due to colder than average
temperatures for that period, as well as recovery of under-charged revenue from
2022/23 under the Commerce Commission’s revenue framework);
(ii) CIAL (+$22 million) from a
greater increase in the value of the investment property portfolio by
$13 million (2024/25 +$26 million; 2023/24 +$13 million), an increase in
passenger numbers through the airport by around 142,000, higher returns from the
new retail offerings in the terminal, and increased property rental income due
to high occupancy and expansion of the freight and logistics precinct; and
(iii) LPC (+$10 million) from a 24% increase
in bulk imports and price increases.
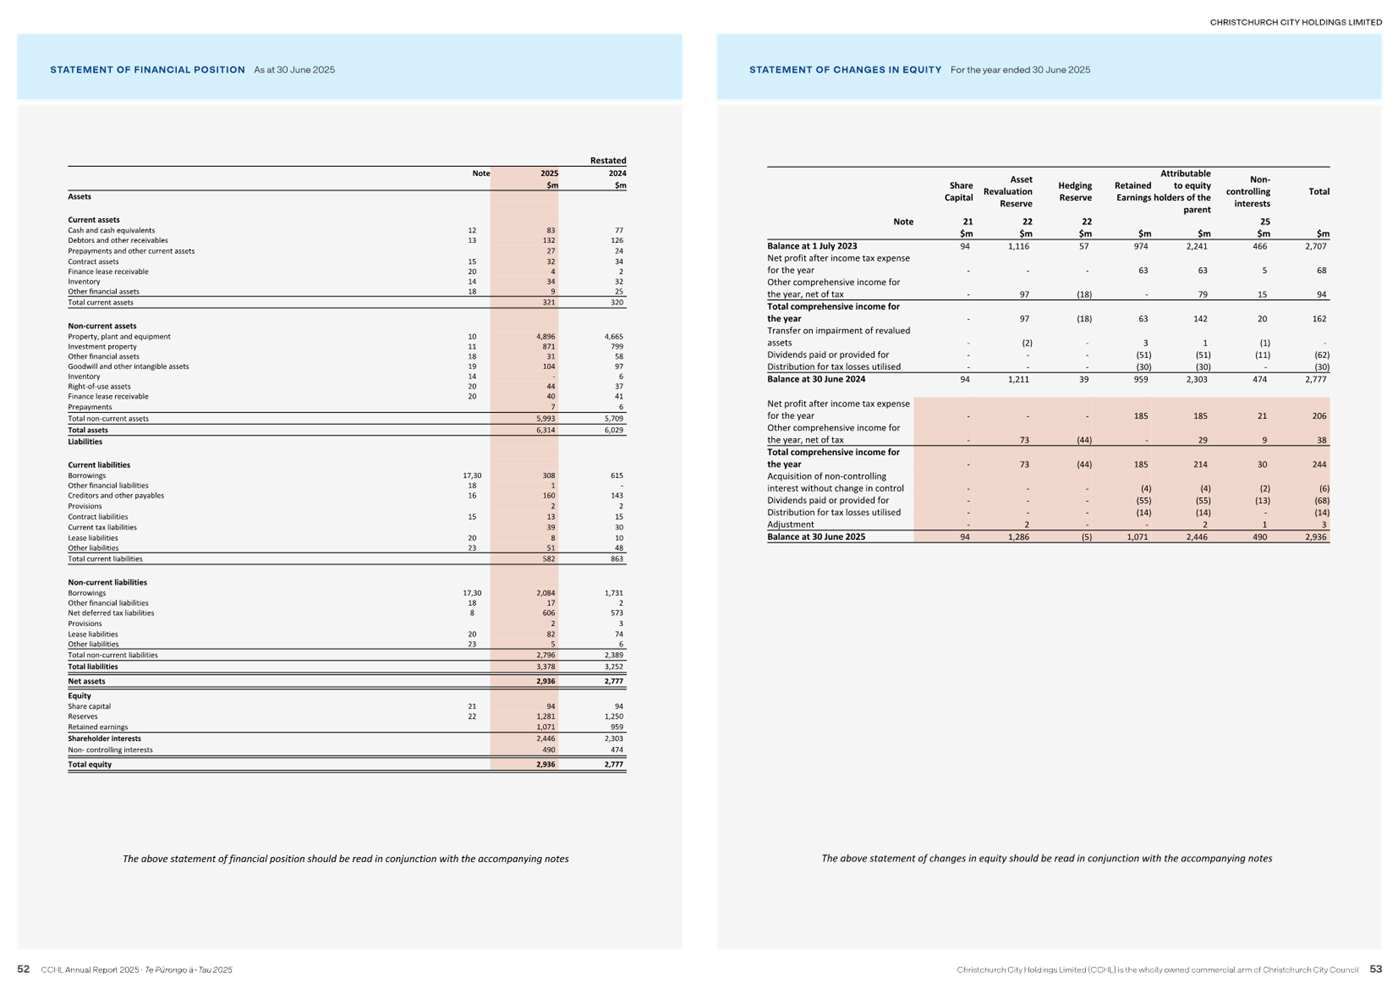
5.10 Total assets
for the Group increased by approximately $285 million (4.7%) mostly
attributable to CIAL (+$141 million) from revaluation of investment land
and airport terminal assets, Orion (+$50 million) from investment in the
electricity network), and LPC (+$71 million) from revaluation of the Port
assets). Debt across the group increased by $46 million to support
reinvestment in the assets, an increase of 2%, which is less than the asset
growth.
Profitability trends
5.11 The
following chart presents the trend in NPAT (normalised in 2024 and 2025) of the
CCHL subsidiary companies since 2020:
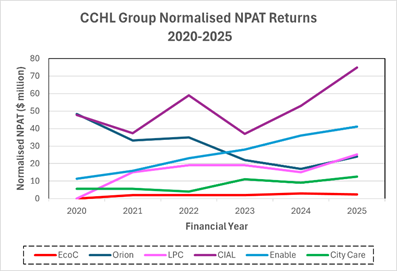
5.12 Note
that:
(i) Orion’s
declining returns over the five year period reflects the five-year regulatory
price-path that has been set by the Commerce Commission; and
(ii) CCHL’s NPAT has
included non-cash fair value gains on investment land of $148 million in total
over the six year period.
5.13 A five year
comparison of total asset value is shown below:
|
|
2019/20
$m
|
2020/21
$m
|
2021/22
$m
|
2022/23
$m
|
2023/24
$m
|
2024/25
$m
|
|
Total assets
|
4,548
|
4,793
|
5,252
|
5,830
|
6,029
|
6,314
|
|
Shareholder equity
|
1,849
|
2,053
|
2,434
|
2,707
|
2,777
|
2,936
|
|
Debt
|
2,045
|
2,081
|
2,130
|
2,283
|
2,346
|
2,392
|
|
Dividends to the Council
|
22
|
34
|
16
|
32
|
51
|
55
|
|
Return on Equity
|
-2.9%
|
4.8%
|
5.4%
|
3.9%
|
2.5%
|
5.6%
|
|
Growth in asset value
|
7.0%
|
5.4%
|
9.6%
|
11%
|
3.4%
|
4.7%
|
|
NZGS 10 year bonds (for comparison)
|
1.1%
|
1.2%
|
2.7%
|
4.2%
|
4.8%
|
4.5%
|
Climate change and greenhouse gas
emissions reductions
5.14 Across the group
there has been a gross 12% reduction in scope 1 & 2 greenhouse gas
emissions since 2022 and a 1% reduction on the previous financial year.
5.15 Each of
CCHL’s subsidiaries have specific climate-related performance targets in
their respective SOIs. All but Orion have met those targets in 2025/26. Orion
did not achieve its emissions reduction target (year on year reduction) as
signalled to the Council earlier this year. However, its emissions are a reduction on its 2020 baseline. Orion
advises it has reviewed its overall target set for 2030 and considers it is
still achievable as it expects initiatives from 2027 to more than offset the
shortfall to date, which includes reducing carbon emissions from its fleet.
5.16 CCHL is a
Climate Reporting Entity under the Financial Markets Conduct Act 2013 and is
therefore required to publish annual climate statements in accordance with
Climate Standards. The climate statements reflect the short-, medium-,
and long-term risks and opportunities that climate change presents for the
activities of the CCHL group and how they are considering those risks and
opportunities (refer Attachment B for the Climate Statements). CCHL will
present its progress on meeting its climate change goals in relation to the
Group’s Emissions Reduction Plans at a workshop in early 2026.
Non-financial
performance targets
5.17 CCHL has 16 performance targets in its SOI, excluding climate change
targets. The subsidiary companies each have individual targets tailored
to their operations. CCHL has not met several of its targets this year,
as follows:
(i) Introduction of a group capital allocation framework has not been
delivered and reflects that each of the subsidiary company boards is
responsible for their capital structure/capital
allocation. CCHL reviews and influences through the SOI process.
(ii) A
best practice gender diversity ratio of 40/40/20 male/female/any was not
achieved with 22.6% female against a target of 40%. The nature of the
work that several of the subsidiary companies undertake have traditionally been
male dominated (e.g. Orion, LPC and City Care) and it is taking time to reach
the gender diversity goals. CCHL advises that it
will continue to support the subsidiaries to implement initiatives to improve
and retain diversity across the group, such as working with subsidiaries to
identify barriers to entry and ways to reduce these barriers.
(iii) Associated
with the above, the CCHL group has been unable to close its gender pay gap.
(iv) Staff
(via engagement index) either ‘strongly agree’ or
‘agree’ to five standard questions which are used to gauge levels
of workplace engagement – not achieved. Each of the subsidiary
companies has its own frameworks for evaluating staff levels of workplace
engagement. In its 2025/26 SOI, CCHL included a new target to receive
(for monitoring purposes) annual staff engagement outcomes from the subsidiary
companies. CCHL advised (at that time) that the subsidiary companies
committed to providing this information to it and updates as they are available
through quarterly reporting.
(v) Zero serious harm incidents was not
achieved due to LPC having experienced a higher than usual number of manual
handling incidents which required either medical treatment or absence from work
due to injuries. LPC has implemented a plan that includes enhancing
leadership, improving work practices, increasing training and upgrading assets
to ensure a healthy safe workforce. In its Annual Report for 2025, LPC
notes that (refer to page 12 of LPC’s Annual Report):
Our core focus
Health and safety performance remained a top priority for LPC in FY25. The
Board and management have focused on driving significant improvements, with a
comprehensive plan that includes enhancing leadership, improving work
practices, increasing training and upgrading assets to ensure a healthy, safe
workforce. A major focus of the Container Terminal restructure has been to
deliver better health and safety outcomes across the terminal and workforce.
The period has also presented challenges. In FY25 our long-term injury
frequency rate was up due to a complex interplay of factors ranging from
fitness to work to behaviours and practices. We are working hard to understand
this issue so that we can address it effectively. Other actions taken this year
have included a reduction in tolerance for unsafe behaviours, implementation of
a new Homesafe Safety Management system, strengthened leadership and
consequences, CEO-led townhall meetings with all staff, safety-related
infrastructure improvements and a maturing safety mindset.
(vi) Reduction in total recordable
injury frequency rate (TRIFR) – this did not decrease due to a high
number of sprain and strain injuries across the CCHL subsidiaries. CCHL
notes health and safety will continue to be a priority.
6. Next steps Ngā Mahinga ā-muri
6.1 CCHL
will speak further to the Annual Report and the financial and non-financial
performance results at its AGM to be held on 28 November 2025.
Attachments Ngā Tāpirihanga
|
No.
|
Title
|
Reference
|
Page
|
|
a ⇩ 
|
Christchurch
City Holdings Ltd - Annual Report 2024/25
|
25/2247945
|
117
|
|
b ⇩
|
Christchurch
City Holdings Ltd - Climate Statement 2025
|
25/2308244
|
193
|
In addition to the attached documents, the following background
information is available:
|
Document
Name – Location / File Link
|
|
Not
applicable
|
Signatories Ngā Kaiwaitohu
|
Author
|
Linda Gibb -
Performance Monitoring Advisor CCO
|
|
Approved By
|
Chris Walthew
- Group Financial Controller
Bede Carran -
General Manager Finance, Risk & Performance / Chief Financial Officer
|
|
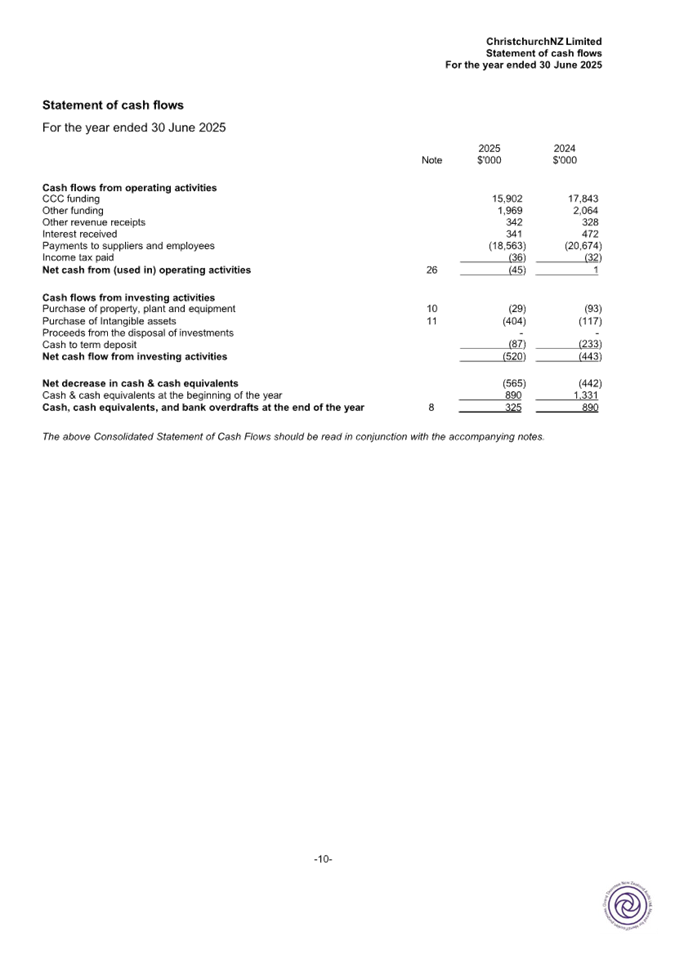
11. ChristchurchNZ
Holdings Ltd - Annual Report 2024/25
|
|
Reference Te Tohutoro:
|
25/1865413
|
|
Responsible Officer(s) Te Pou Matua:
|
Linda
Gibb, Performance Advisor, Finance
|
|
Accountable ELT Member Pouwhakarae:
|
Bede
Carran, General Manager Finance, Risk & Performance / Chief Financial
Officer
|
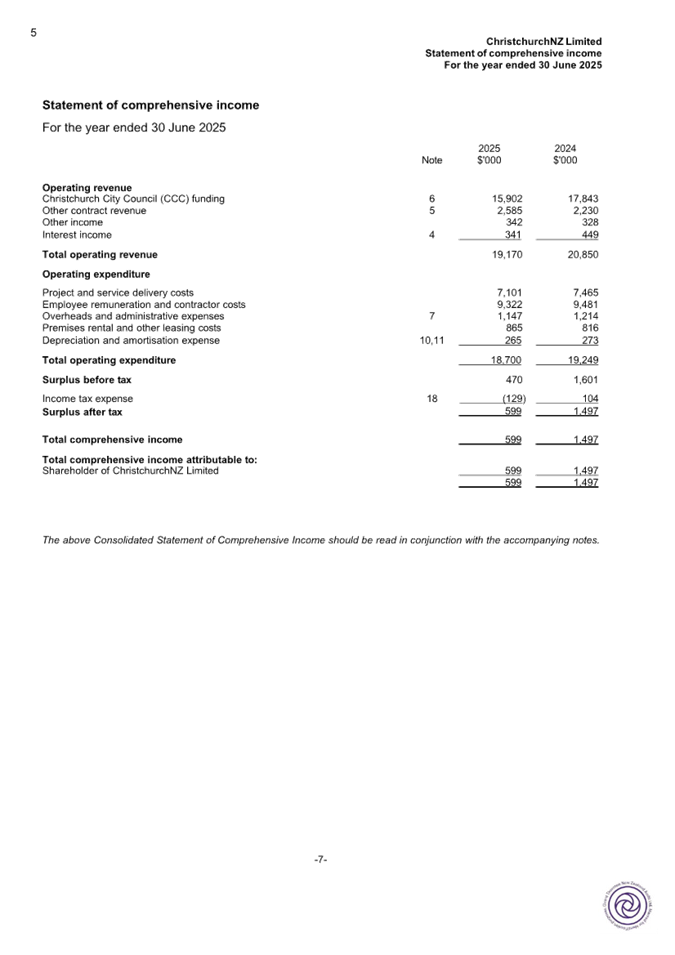
1. Purpose and Origin of the Report Te Pūtake Pūrongo
1.1 The
purpose of this report is to present ChristchurchNZ Holdings Ltd’s
(CNZHL’s) annual results for the year ending 30 June 2025. This
includes a companion report of activity for Quarter 1 2025/26 (1 July-30
September).
1.2 This
report has been written following receipt, on 16 October 2025, of CNZHL’s
Annual Report for the year ending 30 June 2025 and includes the financial
statements and the auditor’s report (refer Attachment A).
The Quarter 1 report is at Attachment B.
2. Officer Recommendations Ngā Tūtohu
That the Finance and
Performance Committee:
1. Receives the information in the ChristchurchNZ
Holdings Ltd - Annual Report 2024/25 and Quarter 1
2025/26 Performance Report.
3. Background/Context Te Horopaki
3.1 CNZHL’s
focus is on delivering sustainable economic growth to Christchurch primarily
through attracting visitors, businesses, investment and events to the city,
supporting urban development, assisting businesses to achieve and maintain
sustainability goals, and promoting the adoption of new technologies and
innovation.
3.2 The
majority of CNZHL’s total funding of $19.2 million in 2024/25 is from Council
($15.9 million). Third party income ($3.3 million in 2024/25,
including interest of $341k) makes an important contribution to CNZHL’s
outcomes, by enabling it to leverage the Council’s funding to magnify net
benefits to the city.
3.3 In
its Letter of Expectations (LOE) to CNZHL, dated 19 December 2024, the Council
advised that Quarter 1 performance reporting be provided at the same time as
presentation of the annual results, while maintaining a clear distinction
between the two.
Annual Report
3.4 Section
67(1) of the Local Government Act 2002 (LGA) requires the board of a CCO to
submit an annual report to shareholders within three months of the end of the
financial year (by 30 September). CNZHL’s Annual Report for
the year ending 30 June 2025 was received on 16 October, due to a delay in
receiving auditor sign-off relating to a statement of service performance audit
requirement. There are no adverse consequences for CNZHL or the Council
from late delivery of its Annual Report.
3.5 CNZHL’s
2024/25 Annual Report complies with section 67(2) of the LGA by including: a
comparison of performance with the SOI, explanations of material variances, and
the auditor’s report on the financial statements and performance measures
(sections 68 and 69 of the LGA).
3.6 CNZHL’s
auditor issued an unmodified opinion confirming that the financial statements
fairly present its financial position as at 30 June 2025 and its performance
for the year. The unmodified opinion also confirms the statement of performance
fairly presents actual results against SOI targets. The auditor included an
emphasis of matter, which does not modify the opinion, regarding the basis for
certain performance measures and noted that national work is underway to review
future KPIs.
Measuring
performance
3.7 Dating
back to 2018 the Council has requested that CNZHL develop outcome-focused key
performance indicators (KPIs) that are clearly linked to economic outcomes in
the short, medium and long term. This request aligns with ‘Good Practice
in Reporting about Performance’[1] as outlined by the Office of the Auditor-General (OAG) in
partnership with Audit New Zealand and the Treasury. The guidance
recommends that effective performance reporting should show how an organisation
is achieving its outcomes and impacts through the provision of its activities
and services.
3.8 Accordingly,
CNZHL’s performance reporting was re-focussed on outcomes and impacts
from its activities to increase Christchurch’s: GDP growth, employment
growth, investment into the city and visitor spending. This replaces the
former ‘inputs-focussed’ reporting, such as number of meetings,
publications, engagements, bids, and enquiries delivered.
3.9 CNZHL’s
SOI targets for economic outcomes for Christchurch are underpinned by the
Council’s Economic Ambition including to support:
· creation of long-lasting jobs;
· creation of short-term jobs through events, urban development and
screen activity;
· GDP growth;
· visitor spend; and
· investment into Christchurch.
3.10 In its LOE, the
Council advised CNZHL that it would like its performance reporting to continue
to include an annual estimate of returns on Council’s investment in
CNZHL, including both quantified and unquantifiable/qualitative returns.
3.11 In its Annual
Report (refer page 29) CNZHL noted that it is committed to articulating
the value it delivers to the community, its partners and funders. It
provides information about its returns, accompanied by explanations (refer page
30 of the financial statements) on the methodology for attributing economic
outcomes from its work. This includes that the methodologies for
monitoring the outcome measures utilise a mix of data, customer survey
responses and modelled estimates (which necessitates the application of some
assumptions and judgements).
3.12 Based on the
returns CNZHL has reported in its Annual Report, the return on Council funding
is estimated at $6.66 per dollar of Council funding (2023/24: $5.27).
3.13 Earlier this
year, Council commissioned a section 17A review of its economic development
activities under the LGA. The review included a broad range of CNZHL’s
work, with the Reviewer’s conclusions mainly focused on major event
delivery, urban development, inward investment, and destination promotion.
Staff are preparing a report back to Council.
3.14 The
review also raised concerns on the robustness of current economic performance
measures in reflecting CNZHL’s contribution to Christchurch’s
outcomes. Both CNZHL and Council staff have noted the difficulty of isolating
impacts given complex indicators and time lags. CNZHL advises its approach has
been conservative, but there is scope to explore this further in the upcoming
report.
3.15 CNZHL has also advised that the challenge of measuring outcomes from
the work of economic development agencies and regional tourism organisations is
a national and international issue. There is work is underway, led by
Economic Development NZ to consider a national approach to setting and
measuring relevant performance measures.
4. Considerations Ngā Whai Whakaaro
Annual Report 2024/25
4.1 Key
financial measures for the year are summarised in the table below:
|
|
Actual
$m
|
SOI budget
$m
|
Variance
$m
|
Prior year
$m
|
Variance
$m
|
|
CCC funding
|
15.9
|
15.9
|
-
|
17.8
|
-1.9
|
|
Other
funding
|
3.3
|
2.3
|
+1.0
|
3.0
|
+0.3
|
|
Operating
expenditure
|
(18.6)
|
(18.8)
|
-0.2
|
(19.3)
|
-0.7
|
|
Total
surplus/(loss) after tax
|
0.6
|
(0.6)
|
+1.2
|
1.5
|
-0.9
|
|
Total Assets
|
8.4
|
4.9
|
+3.5
|
8.4
|
-
|
|
Equity
|
6.2
|
3.0
|
+3.2
|
5.6
|
+0.6
|
4.2 Against SOI budget,
third party revenue is higher by $1 million from new one-off funding attracted
by CNZHL for screen grants, the Buskers Festival,
and a winter tourism campaign. Additionally, contributions to campaigns and events were received from Selwyn and Hurunui
District Councils, Christchurch International Airport Ltd and TourismNZ.
4.3 Against
last year, the surplus after tax is lower by $0.9 million which largely
relates to a one-off Council seed funding grant for major events of $1.9
million in 2023/24. This was partially offset by higher third party
revenue in 2024/25 of $0.3 million as contributions to campaigns and events, and lower than planned
activity costs of $0.5 million largely due to timing of activities.
4.4 Total
Assets, were $3.5 million higher than the SOI budget, largely due to
reserving cash for events and screen grants over time which is also reflected
in the increased equity.
Economic performance
4.5 The
charts below, based on information in the Annual Report, shows how CNZHL has
performed against its economic KPIs for the year (refer Note 27, page 29):
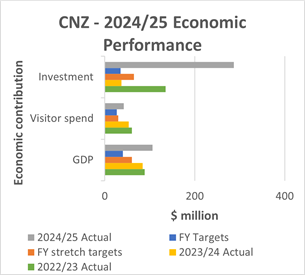
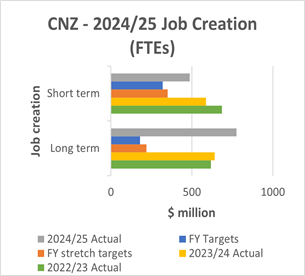
4.6 Staff
note that:
· performance is assessed as CNZHL’s contribution to the
outcomes sought; and that the market is dynamic with a number of factors at
play which are outside CNZHL’s control;
· the most notable variance is investment value, estimated at $286.6
million for 2024/25 compared to a target of $35 million (and a stretch target
of $65 million). This reflects two major city investments: the Christchurch
Engine Centre’s $250 million commitment to future-proof its services, bringing
new jobs, skills and residents to Christchurch and BioOra’s decision to
establish a $10 million manufacturing facility in Christchurch, also expected
to bring new jobs, skills, and residents to the city. Further details on
BioOra, including anticipated benefits for Christchurch, are on pages 4 and 5
of CNZHL’s Annual Report and include noting CNZHL’s pivotal role in
attracting BioOra to Christchurch.
Non-financial
performance targets
4.7 KPIs
in the SOI have been achieved with one exception. The staff engagement
survey score of 4.5 or above for staff feeling of being safe was 0.18 points
below target on a 5 point scale at 4.32 and is not considered a material
variance.
4.8 Levels
of Service which are akin to contractual terms and conditions underpinning the
Council’s funding have all been achieved.
Trend analysis
4.9 The
majority of CNZHL funding is applied to the delivery of projects and services
costs including personnel. The following table identifies how
CNZHL’s overhead costs have changed with funding levels over the past six
years:
|
|
2019/20
$000
|
2020/21
$000
|
2021/22
$000
|
2022/23
$000
|
2023/24
$000
|
2024/25
$000
|
|
Council funding
|
11,849
|
11,328
|
16,335
|
15,902
|
15,943
|
15,902
|
|
3rd Party funding
|
2,661
|
4,938
|
6,700
|
7,481
|
2,230
|
2,585
|
|
Sundry funding
|
1,177
|
507
|
401
|
802
|
2,677
|
683
|
|
Total funding
|
15,687
|
16,773
|
23,436
|
24,185
|
20,850
|
19,170
|
|
Total overheads
|
3,381
|
2,783
|
2,827
|
4,440
|
2,303
|
2,277
|
|
Overheads as a % of total funding
|
21.6%
|
16.6%
|
12.1%
|
18.4%
|
11.0%
|
11.9%
|
|
CNZ contribution to GDP ($000)
|
-
|
-
|
93,000
|
89,000
|
84,000
|
106,000
|
|
GDP return per $ CCC funding
|
-
|
-
|
$5.70
|
$5.60
|
$5.27
|
$6.66
|
4.10 Notes to the
above table:
· Higher levels of 3rd party funding were received in
2020/21, 2021/22 and 2022/23 from the government’s COVID-19 tourism
grants, noting that CNZHL’s overheads increased during this period to
deliver against these contracts;
· Sundry funding of $1.9 million was received in 2023/24 from the
Council’s Annual Plan for major events;
· 3rd party funding from central government is not able to
fund initiatives already funded by the Council – it is required to be
applied solely to new services and activities; and
· Overheads include office accommodation, depreciation and
amortisation, audit fees, communications and IT expenses, directors fees and administrative
expenses.
Quarter 1
2025/26 Performance
4.11 ChristchurchNZ’s
Quarter One report (refer Attachment B) outlines activity across
economic development, tourism, and city promotion. It overviews the work
undertaken for the September quarter, including an update on the local economy
and activity in business growth and investment, the visitor economy, events,
and city promotion. The report also notes progress on strategic initiatives
such as the regional aerospace strategy and records a year-to-date financial
surplus, primarily due to timing of expenditure.
4.12 Section 6 of
the quarterly report is looking ahead over the six months October 2025 –
April 2026, and it notes upcoming campaigns and major events, including
international conferences, Antarctic season activities, and longer-term
projects such as a proposed hydrogen hub and event partnerships projected to
contribute to the visitor economy.
Attachments Ngā Tāpirihanga
|
No.
|
Title
|
Reference
|
Page
|
|
a ⇩
|
ChristchurchNZ
Ltd - Annual Report 2024/25
|
25/2174479
|
229
|
|
b ⇩
|
ChristchurchNZ
Holdings Ltd - Quarter 1 Performance Report
|
25/2312287
|
292
|
In addition to the attached documents, the following background
information is available:
|
Document
Name – Location / File Link
|
|
Not
applicable
|
Signatories Ngā Kaiwaitohu
|
Author
|
Linda Gibb -
Performance Monitoring Advisor CCO
|
|
Approved By
|
Chris Walthew
- Group Financial Controller
Bede Carran -
General Manager Finance, Risk & Performance / Chief Financial Officer
|
|
12. Council-controlled
Organisations - Annual Reports 2024/25
|
|
Reference Te Tohutoro:
|
25/1866418
|
|
Responsible Officer(s) Te Pou Matua:
|
Linda
Gibb, Performance Advisor, Finance
|
|
Accountable ELT Member Pouwhakarae:
|
Bede
Carran, General Manager Finance, Risk & Performance / Chief Financial
Officer
|
1. Purpose and Origin of the Report Te Pūtake Pūrongo
1.1 The
purpose of this report is to present the Annual Reports 2024/25 with audited
financial statements for the following Council-controlled organisations (CCO)
– Transwaste Canterbury Ltd (Transwaste), Riccarton Bush Trust (RBT), Rod
Donald Banks Peninsula Trust (RDBPT) and Te Kaha Project Delivery Ltd (TKPDL),
refer Attachments A-D for the respective annual reports.
1.2 Also
included are the Quarter 1 Performance Report (1 July-30 September) for Te Kaha
Project Delivery Ltd (refer Attachment E)
and the Half Year Report (1 January - 30 June) for Civic Financial Services Ltd
(Civic), refer Attachment F.
1.3 This
report is staff generated and has been written following receipt of the reports for the above-named organisations in September and
October.
2. Officer Recommendations Ngā Tūtohu
That the Finance and
Performance Committee:
1. Receives the Annual Reports for 2024/25 with
audited financial statements for the following Council-controlled
Organisations:
· Transwaste Canterbury Ltd;
· Riccarton Bush Trust;
· Rod Donald Banks Peninsula Trust; and
· Te Kaha Project Delivery Ltd.
2. Notes that all the above entities received
unmodified audit opinions.
3. Receives the Quarter 1 2025/26 Performance
Report for Te Kaha Project Delivery Ltd; and
4. Receives the Half Year Report 2025 for Civic
Financial Services.
3. Background/Context Te Horopaki
3.1 This
report covers three separate reporting periods which are:
(i) annual
reports for Transwaste, RBT, RDBPT and TKPDL;
(ii) first
quarter report for TKPDL; and
(iii) half-yearly
report for Civic.
Annual reports
3.2 Section
67(1) of the Local Government Act 2002 (LGA) requires the board of a CCO to
submit an annual report to its shareholders within three months of the end of
the financial year.
3.3 Section
67(2) of the LGA requires an annual report to include the information required
by sections 68 and 69 of the LGA, which includes comparing performance with the
Statement of Intent (SOI), explaining material variances and including an
auditor’s report on the financial statements and the performance targets
and other measures by which performance was judged in relation to the
organisation’s objectives.
3.4 The
CCOs’ Annual Reports for 2024/25 meet the LGA requirements and all have
unqualified audit opinions, indicating that the financial and performance
statements are presented fairly in all material respects.
3.5 There are two CCOs which
have not, at the date of this report, delivered Annual Reports for 2024/25:
Civic Building Ltd and Central Plains Water Trust, both awaiting audit
clearance.
Quarterly and half yearly reports
3.6 Section 66(3) of the LGA provides that if the shareholders of a CCO
notifies it that they require quarterly reporting, they must be delivered
within two months after the end of the first and third quarters of each
financial year. Section 66(4) provides that each report must include the
information required to be included by the CCO’s SOI.
3.7 TKPDL’s
Quarter 1 performance report for the period 1 July – 30 September
2025 was received on 14 October well before its due date of 30 November.
3.8 Civic
is not a CCO (due to a technicality) and therefore the LGA’s statutory
requirements for delivery of a half year report (within two months of the end
of the half year) do not apply. Staff note its half yearly report was
received by Council on 3 September 2025.
4. Considerations Ngā Whai Whakaaro
4.1 The
following are summaries of each CCO’s performance for 2024/25.
Transwaste Canterbury Ltd
4.2 Transwaste operates the Kate Valley Landfill which is required to
accept non-hazardous waste from within the Canterbury region.
4.3 The company is owned jointly by five Canterbury councils (50%) and
Waste Management NZ Ltd (50%). The Christchurch City Council owns 38.9%
of the total shares on issue. Other councils with shareholdings are the
Ashburton, Hurunui, Selwyn and Waimakariri District Councils. The five
local authority shareholders have delegated governance issues to the Canterbury
Regional Landfill Joint Committee.
4.4 Transwaste’s
Annual Report for 2024/25 is at Attachment A. Its financial performance is summarised in the table below:
|
Financial
Performance
|
Actual
2024/25
$000
|
SOI target
2024/25
$000
|
Actual
2023/24
$000
|
|
Earnings
before interest and tax (EBIT)
|
20,275
|
21,329
|
21,098
|
|
Total dividends paid (Kate Valley
Final
dividend paid (Burwood Resource Recovery Park)
|
14,650
5,000
|
14,900
5,000
|
12,050
0
|
|
Total assets
|
77,444
|
-
|
76,874
|
|
Equity
|
31,547
|
|
37,052
|
|
Shareholders’
funds as % of Total Assets
|
40.7%
|
40.7%
|
48.2%
|
|
|
|
|
|
|
Government
waste levy
|
20,777
|
21,300
|
17,753
|
|
Total waste
to landfill (tonnes)
|
346,287
|
355,000
|
355,048
|
4.5 Lower
waste volumes by circa 9,000 tonnes and operating cost pressures have led to a
reduction in Transwaste’s profitability for the year against target by
$1.05 million and against last year’s result by $0.82 million.
4.6 Dividends
paid in 2024/25 were made up of two components – the annual Kate Valley
dividend of $14.6 million of which the Council’s 38.9% share was $5.7
million; and a final distribution of the $5 million
cash held by Transwaste for contingency in the event of any claims arising
relating to the Burwood Resource Recovery Park which was set up to receive
earthquake waste. The Council’s share was $1.9 million. The
distribution was forecast in the SOI and is reflected in the reduction in
shareholders’ funds as a percentage of total assets by 7.5%.
4.7 The
Kate Valley dividend is higher by $2.6 million in 2024/25 over the prior
year. This was due to the 2023/24 dividend being partially brought
forward and paid out in 2022/23 to enable full
utilisation of imputation credits that would otherwise have been lost following
a change of ownership of Waste Management.
Non-financial
performance targets
4.8 The
following non-financial performance targets were not achieved by year end:
Target: replacement of grid supply by onsite green supply for a 50%
reduction in grid electricity consumption over the SOI period
The target is a
multi-year one. Expectations are for it to be achieved by 30 June 2027.
Target: increase the beneficial use of landfill gas by 25% over the
five year period to 2029
As reported previously, Transwaste has
been unable to export all the electricity generated due to transmission line
capacity constraints between MainPower and the national grid. This is
subject to ongoing discussions with the regulatory authorities.
Transwaste has also been investigating other options for which its excess
electricity could be used, including electrification of its own fleet.
Target: develop and distribute carbon emissions reporting to
territorial local authorities (TLAs).
This target supports Transwaste’s
commitment to reporting annual carbon emissions attributable to the waste
received from each TLA area. It has been difficult for Transwaste to get
a timely audit from Toitū to validate the data. Transwaste is
currently considering whether there is merit in its releasing the reports to
the TLAs without the Toitū audit.
Target: health and safety
Maintain or
improve current total recordable injury frequency rate (TRIFR) which was zero
has not been met. One medical treatment injury (a cut finger needing
stitches) occurred. The target for ‘no at-fault incidents’
has been incorrectly registered as one (and therefore the target not
achieved). However, the event was not of Transwaste’s making and determined by the police that the Transwaste vehicle was not at
fault.
Carbon emission
reporting
4.9 Page
10 of the Annual Report provides Transwaste’s most recent (2024) certified emissions results. It advises that its
emissions in 2024 were 12,201 tonnes of CO2 compared with its 2022
baseline of 32,723 tonnes (a reduction of more than 2.5 times). This is
largely due to better gas capture since 2022 (gas capture in 2022 was 86% and
95% in each of 2023/24 and 2024/25) coupled with a lower volume of waste by
2.6% to the landfill in 2024/25.
4.10 Transwaste
has advised that while it is actively seeking to reduce its emissions from
transportation (it bought an EV truck late in 2025 for a trial - expected to
start in November 2025), the biggest impact on reducing emissions further is
improving its gas capture to offset the approximately 5% ‘fugitive’
emissions.
Riccarton
Bush Trust
4.11 Riccarton
Bush Trust is a charitable trust, with a break-even profit objective. The
Trust administers 7.8 hectares of native bush and Riccarton (historic)
House. The Trust was incorporated under an Act of Parliament in
1914. The Riccarton Bush Amendment Act 2012 underpins the Council’s
financing obligations to the Trust.
4.12 The
key drivers of the Trust’s financial performance are income from the
on-site café (The Quarters), the Saturday morning market, tours and the
Council’s annual operating and capital grants. Third party
grants and donations can also contribute significantly when they occur.
The upkeep of the house and bush and staff salaries are the Trust’s
largest costs.
4.13 RBT’s Annual Report for 2024/25 is at Attachment B.
|
Riccarton Bush Trust
|
Actual
2024/25
$000
|
SOI target
2024/25
$000
|
Variance
Act v Target
$000
|
Actual
2023/24
$000
|
Variance
Act v LY
$000
|
|
Net deficit
|
(2)
|
(244)
|
+242
|
(41)
|
+39
|
4.14 Against the SOI target, the deficit is lower by $242,000 as a result of higher operating
revenue of $239,000 and lower operating costs of $2,000. Higher operating
revenue is attributable to grants and donations of $237,000 mostly to fund the
boardwalk replacement project.
4.15 Against
the prior year, the deficit is lower than last year
by $39,000 from higher revenue of $112,000 reduced by higher costs of $73,000
(refer Notes 1 and 2; page 11 of the Financial Statements, Attachment B).
The higher depreciation and project costs both relate
to the bush enhancement project.
Non-financial performance
4.16 A
visitor summary on page 6 of the Annual Report shows a 12% decline in visitor
numbers for 2024/25 compared with the previous year. This is mainly due to
reduced patronage at the restaurant and The Quarters café, likely
influenced by current economic conditions, and fewer bush walks and utilisation
of other Riccarton House and Bush offerings, partly reflecting lower
café and restaurant usage. The Bush was also closed from early
June for the bush enhancement project works.
4.17 All non-financial performance measures have
been met, with one exception. In its SOI for
2024/25 the Trust committed to developing a plan with clear targets for
reducing carbon in the Trust’s operations to meet the target of becoming
net carbon neutral by 2030. The Annual Report shows the measure as having
been ‘partially met’ at the direction of the auditors.
4.18 Council
staff consider the Trust has done all that is reasonable to demonstrate its
commitment to emissions reductions and the Council’s target to be net
carbon neutral by 2030. Staff from the Council’s Climate Resilience
team have assessed the plan as good and that it shows the Trust has a good
understanding of which activities are causing emissions and what they can and
will do to make changes. The team notes that intermediate emissions
targets are not necessary with five years to go until 2030.
4.19 Council
staff will continue to assist the Trust to articulate its plan in a way that
will meet the auditor’s needs in future.
Rod Donald Banks Peninsula Trust
4.20 The
Trust supports sustainable management, conservation and recreation on Banks
Peninsula. Its Annual Report for 2024/25 is at Attachment C.
|
Rod
Donald Banks Peninsula Trust
|
Actual
2024/25
$000
|
SOI target
2024/25
$000
|
Variance
Act v Target
$000
|
Actual
2023/24
$000
|
Variance
Act v LY
$000
|
|
Operating
surplus/ (deficit)
|
(228)
|
(355)
|
+127
|
1,322
|
-1,550
|
4.21 Against the SOI
target, the operating surplus was higher by $127,000 due to higher revenue
of $43,000, lower allocation of funding to grants and strategic projects of
$115,000 offset by higher expenditure of $31,000.
4.22 Revenue
increases include $19,000 from Rod Donald Hut fees due to both higher prices
and increased utilisation, $15,000 from higher interest rates and increased
cash on deposit following delays in finalising the 2023/24 grants and projects
programme, and $13,000 from a significant one-off donation.
4.23 The
$31,000 increase in expenditure is mainly due to a $10,000 donation to the
newly formed Le Bons Bay Conservation Trust (for a land purchase assessed on an
ad hoc basis), $7,000 for website hosting and IT support, $5,000 for minor
projects, and $7,000 for higher administration costs. Grant funding and
strategic project allocations decreased by $115,000 due to changes in project
timing
4.24 Against last
year, the operating surplus was lower by $1.55 million which largely
reflects the one-off nature of the Council’s capital grant of $1.35
million in 2023/24. Adjusting for the $1.35 million grant, revenue for
2024/25 was $269,000, almost unchanged from $270,000 in 2023/24.
4.25 Total
expenditure rose by $193,000 in 2024/25, mainly due to $129,000 in increased
strategic grants and project spending (see page 22 of the Annual Report:
Attachment C), $48,000 in higher administration costs following a management
transition, a $10,000 donation to Le Bons Bay Conservation Trust, and $7,000
for Te Ara Pātaka maintenance delayed from the prior year.
Non-financial
performance
4.26 All
non-financial performance targets have either been achieved or are in progress.
4.27 The
Trust’s emissions baseline was set in 2024/25 and therefore there is
nothing for the Trust to report on in their 2024/25 annual report.
Te Kaha
Project Delivery Ltd
4.28 TKPDL
is the governance body tasked with the construction of One New Zealand Stadium
at Te Kaha. The responsibility and accountabilities for the final design
and construction of the Stadium are held with the Council’s Vertical
Capital Delivery team which reports to the Council monthly.
4.29 The
Stadium is expected to be completed by April 2026, following which there will
be a one-year defects period. The Stadium will operate over the defects
period.
4.30 TKPDL’s
Annual Report for 2024/25 is at Attachment D and
its Quarter 1 Performance Report is at Attachment E.
|
Te
Kaha Project Delivery Ltd
|
Actual
2024/25
$000
|
SOI target
2024/25
$000
|
Variance
Act v Target
$000
|
Actual
2023/24
$000
|
Variance
Act v LY
$000
|
|
Annual
Report:
Expenses /
Revenue – note revenue is matched to offset expenditure
|
601
|
680
|
-79
|
616
|
-15
|
4.31 Against
SOI target, costs are lower by $79,000 as a result of lower
consultants’ fees and travel costs of around $50,000 largely reflecting
the good progress of the project. Timing with which payments
are made accounts for a further $20,000.
4.32 Non-financial
performance targets, of the 26 targets, one only has not been
achieved. This is for the completion of the stage gate review for the
design and construction. However, this reflects the case where none was
required. There may be one final stage gate (completion) review but
whether and when that will be sought has yet to be determined.
Quarter 1
Performance Report
|
Te
Kaha Project Delivery Ltd
|
Actual
2024/25
$000
|
SOI target
2024/25
$000
|
Variance
Act v Target
$000
|
|
Quarter
1: Expenses /
Revenue
(note revenue is
matched to offset expenditure)
|
53
|
87
|
-34
|
4.33 Expenses
are lower by $34,000 in Quarter 1 2025/26 which reflects the timing with which
directors fees are paid and will correct by the time the project is
completed. All performance targets have been achieved or are on track to
be achieved by year end.
Civic Financial Services Ltd
Half year report for
the six months ending 30 June 2025
4.34 The
Council has a 12.6% ownership stake in Civic. There are 73 other local
authority shareholders. Civic’s main business is the administration
of superannuation schemes for local government employees of which investment
funds total around $6.5 billion at end July 2025. These funds are managed
by investment specialists.
4.35 Civic’s
half year report for the six months ending 30 June 2025 is at Attachment F.
4.36 Civic is not a
CCO. It is exempted under section 6(4)(f) of the LGA due to its previous
insurance activities that brought it under the Municipal Insurance Act 1960
(now repealed). The half year performance for Civic is summarised in the
table below.
|
Civic Financial Services
|
Actual half year 2025*
$000
|
Est SOI target 2025*
$000
|
Prior half year 2024
$000
|
|
Surplus after
tax
|
58
|
48
|
145
|
|
Superannuation funds under management**
|
654,000
|
Not projected
|
606,000
|
*
Civic does not report against half year SOI targets, however Civic advises that
it is reasonable to assume a 50:50 attribution to each of the six month
periods.
**Superannuation
funds under management have been advised by Civic as at 31 July 2025 and for
2024 at 31 August.
4.37 Against
the half year SOI target, the net surplus is higher by $10,000 largely from
lower operating costs by $20,000, offset in part by reduced investment fees and
higher tax of $4,000.
4.38 Against
last year, the after tax surplus decreased by $87,000. While there was
higher administration fee income of $96,000 from growth in funds under
management (of $48 million), this was more than offset by the 0.1% reduction in
fees (from 0.33% to 0.32% from 1 April 2025) and a significant increase in
operating costs. Operating costs were higher by $179,000 due in part due to
increased costs for managing litigation relating to RiskPool.
Performance Reporting
4.39 In
May 2025, staff sought the Finance and Performance Committee’s agreement
for the Mayor to write to the Civic board to seek some improvements to its
reporting to shareholders. It is pleasing to note that Civic has included
advice of performance of its superannuation funds against the market in its
half year report for the first time.
4.40 There
remains further improvement to be made, particularly in the setting of
performance targets to underpin performance that is at least equal to the
market average.
Attachments Ngā Tāpirihanga
|
No.
|
Title
|
Reference
|
Page
|
|
a ⇩ 
|
Transwaste
Canterbury Ltd - Annual Report 2024/25
|
25/2012259
|
317
|
|
b ⇩
|
Riccarton Bush
Trust Annual Report 2024/25
|
25/2009532
|
378
|
|
c ⇩ 
|
Rod Donald
Banks Peninsula Trust - Annual Report 2024/25
|
25/2012113
|
426
|
|
d ⇩ 
|
Te Kaha
Project Delivery Ltd - Annual Report 2024/25
|
25/2010921
|
464
|
|
e ⇩ 
|
Te Kaha
Project Delivery Ltd - Quarter 1 2025/26 Performance Report
|
25/2044277
|
493
|
|
f ⇩
|
Civic
Financial Services - Half year report to 30 June 2025
|
25/2012037
|
504
|
In addition to the attached documents, the following background
information is available:
|
Document
Name – Location / File Link
|
|
Not
applicable
|
Signatories Ngā Kaiwaitohu
|
Author
|
Linda Gibb -
Performance Monitoring Advisor CCO
|
|
Approved By
|
Bede Carran -
General Manager Finance, Risk & Performance / Chief Financial Officer
|
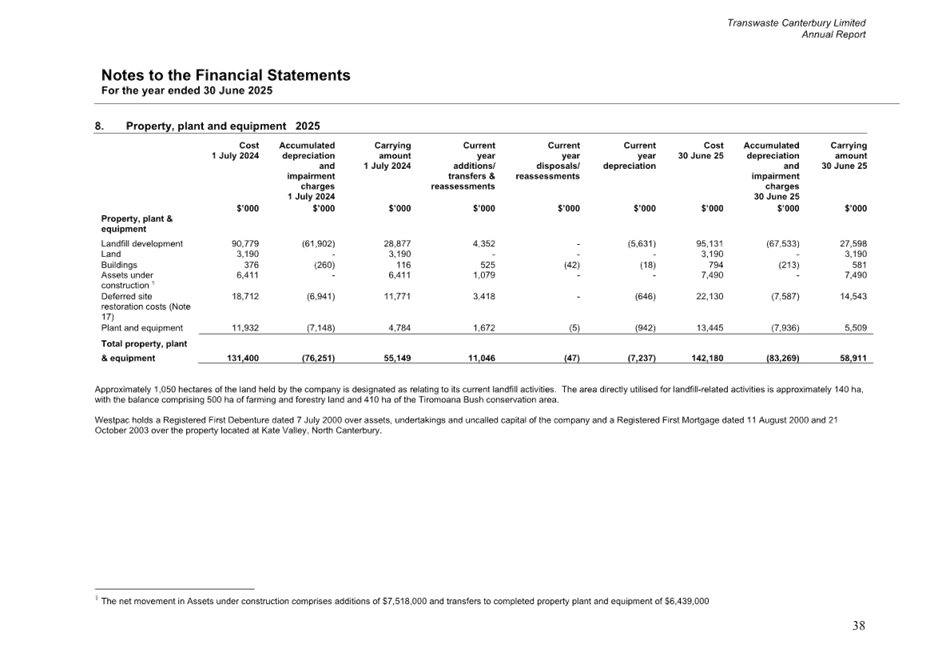
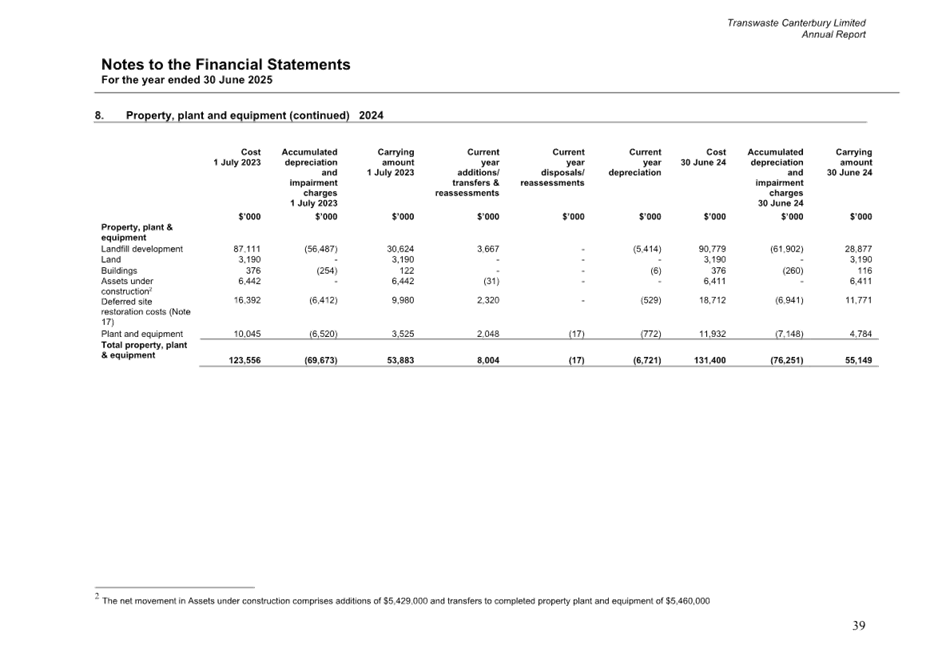
|
13. Council-controlled
organisations - Annual General Meetings by Written Resolution
|
|
Reference Te Tohutoro:
|
25/1867154
|
|
Responsible Officer(s) Te Pou Matua:
|
Linda
Gibb, Performance Advisor
|
|
Accountable ELT Member Pouwhakarae:
|
Bede
Carran, General Manager Finance, Risk & Performance / Chief Financial
Officer
|
1. Purpose and Origin of the Report Te Pūtake Pūrongo
1.1 The
purpose of this report is to seek the Council’s approval for the
following Council-controlled organisations (CCOs) to pass written resolutions,
as permitted by the Companies Act 1993 (Companies Act), in lieu of convening
their 2025 Annual Meetings (AGMs):
· Non-trading ‘shelf ‘companies - CCC One Ltd, CCC Five
Ltd, CCC Seven Ltd and Ellerslie International Flower Show Ltd - the
Council’s Chief Executive is the sole director of the shelf CCOs; the
signed director’s resolutions are at Attachment A;
and
· Trading companies which have no AGM business to transact -
Te Kaha Project Delivery Ltd and Venues Ōtautahi Ltd (VŌ), the
directors’ resolutions for Te Kaha Project Delivery Ltd and VŌ are at Attachments B and C respectively.
1.2 This
report has been written following confirmation from the directors of the
respective companies that they have no AGM business to conduct, and they
wish to pass written resolutions in lieu of holding the AGMs as in-person
meetings.
1.3 VŌ
has advised that it intended to hold an AGM in October this year to avoid its
busy November–December events period. However, as the Council
meeting schedule was disrupted due to the triennial election, it was difficult
to coordinate the meeting, the necessary voting proxies and decisions within
the timeframe. VŌ has confirmed it will hold a physical AGM in
October commencing next year.
2. Officer
Recommendations Ngā Tūtohu
That the Finance and
Performance Committee:
1. Agrees to pass shareholder resolutions for the 2025 annual meetings
of the following Council-controlled organisations:
a. non-trading ‘shelf’ companies - CCC One Ltd, CCC Five
Ltd, CCC Seven Ltd and Ellerslie International Flower Show Ltd; and
b. trading companies –Te Kaha Project Delivery Ltd and Venues
Ōtautahi Ltd; and
2. Notes that the decisions in this report are assessed as low significance
based on the Christchurch City Council’s Significance and Engagement
Policy.
3. Background/Context Te Horopaki
3.1 The
Companies Act (sections 120 and 122(4)) allows a company to meet its AGM
requirements through a written resolution instead of an in-person meeting,
provided there is no business to transact, the board considers this in the
company’s best interests, and the constitution does not require an AGM.
The boards of the respective companies have confirmed these conditions apply
and advise that an AGM would offer no practicable benefit to the shareholder.
Staff support passing a written resolution in lieu of an AGM for the respective
companies.
Options Considered Ngā
Kōwhiringa Whaiwhakaaro
3.2 The
only practicable alternative option is for the CCOs to hold the AGMs as in
person meetings. The cost of doing so, while not high does require
administrative time and resource, and is likely to outweigh any benefits since
there is no business to transact for any of the CCOs.
4. Considerations Ngā Whai Whakaaro
Risks and Mitigations Ngā
Mōrearea me ngā Whakamātautau
4.1 It
is a legal requirement for a company to hold an AGM either by in-person meeting
or by passing a resolution in lieu of the meeting.
Legal Considerations Ngā
Hīraunga ā-Ture
4.2 Statutory
and/or delegated authority to undertake proposals in the report:
· Local Government Act 2002.
4.3 Other Legal Implications:
· section 120 of the Companies Act requires a company to hold an AGM
within six months of its balance date and 15 months of the last AGM, and section
122(4) provides for resolutions to be passed in lieu of the AGM; and
· the constitutions of the respective companies do not require an AGM
to be held.
Strategy and Policy Considerations Te Whai
Kaupapa here
4.4 The
required decisions sought:
· Align with the Christchurch
City Council’s Strategic Framework in that they are consistent with
the Council’s commitment to good governance of its CCOs. This is aligned
to the efficient delivery of the outcomes sought by the Council's
Long Term Plan (2024 - 2034).
· Are administrative only and are therefore of low significance in
relation to the Christchurch City Council’s Significance and Engagement
Policy. The level of significance was determined by considering the
extent to which the decisions might impact the community.
· Are consistent with
Council’s Plans and Policies in terms of the exercise of good governance
practices.
Community Impacts and Views Ngā Mariu
ā-Hāpori
4.5 The
decisions in this report are administrative only and have no impact on the
community.
Impact on Mana Whenua Ngā Whai Take
Mana Whenua
4.6 The decisions in
this report are administrative only and do not involve a significant decision
in relation to ancestral land or a body of water or other elements of intrinsic
value, therefore this decision does specifically impact Mana Whenua, their
culture and traditions.
4.7 The decisions do not impact on our agreed partnership priorities
with Ngā Papatipu Rūnanga.
Climate Change Impact Considerations Ngā
Whai Whakaaro mā te Āhuarangi
4.8 The
proposals in this report will not impact climate change or emissions reductions
since no additional operational activity is created. Forgoing an
‘in person’ AGM will reduce the emissions associated with
transportation of attendees.
5. Next Steps Ngā Mahinga ā-muri
5.1 Execution
of the shareholders’ resolutions in accordance with the Finance and
Performance Committee’s resolutions.
Attachments Ngā Tāpirihanga
|
No.
|
Title
|
Reference
|
Page
|
|
a ⇩ 
|
Non-trading
CCOs - Directors' resolutions to hold AGM 2025 by written resolution
|
25/2319384
|
514
|
|
b ⇩ 
|
Te Kaha
Project Delivery Ltd - Directors' resolution to hold AGM 2025 by written
resolution
|
25/2319468
|
518
|
|
c ⇩
|
Venues
Ōtautahi - Directors' resolution to hold AGM 2025 by written resolution
|
25/2319566
|
519
|
In addition to the attached documents, the following background
information is available:
|
Document
Name – Location / File Link
|
|
Not
applicable
|
Signatories Ngā Kaiwaitohu
|
Author
|
Linda Gibb -
Performance Monitoring Advisor CCO
|
|
Approved By
|
Bede Carran -
General Manager Finance, Risk & Performance / Chief Financial Officer
|
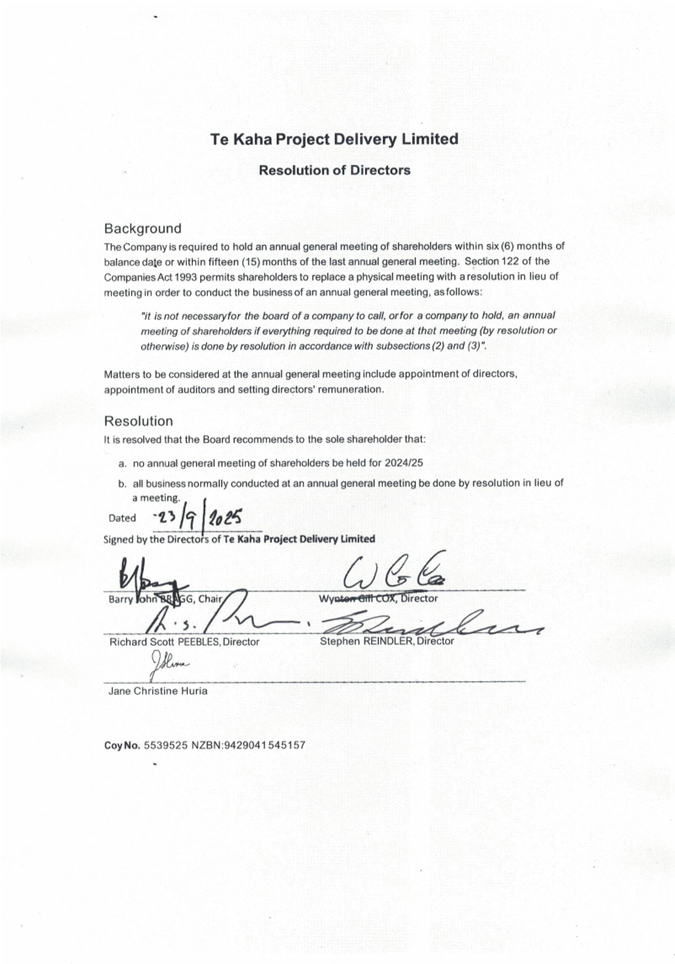

|
14. Resolution to Exclude the Public
|
Section
48, Local Government Official Information and Meetings Act 1987.
Note: The
grounds for exclusion are summarised in the following table. The full wording from
the Act can be found in section
6 or section
7, depending on the context.
I move that the public be excluded from the
following parts of the proceedings of this meeting, namely the items
listed overleaf.
Reason for passing this resolution: a good
reason to withhold exists under section 7.
Specific grounds under section 48(1) for
the passing of this resolution: Section 48(1)(a)
Note
Section 48(4) of the Local Government
Official Information and Meetings Act 1987 provides as follows:
“(4) Every resolution to exclude the
public shall be put at a time when the meeting is open to the public, and the
text of that resolution (or copies thereof):
(a) Shall
be available to any member of the public who is present; and
(b) Shall
form part of the minutes of the local authority.”
This resolution is made in reliance on
Section 48(1)(a) of the Local Government Official Information and Meetings Act
1987 and the particular interest or interests protected by Section 6 or Section
7 of that Act which would be prejudiced by the holding of the whole or relevant
part of the proceedings of the meeting in public are as follows:
|
ITEM NO.
|
GENERAL SUBJECT OF EACH MATTER TO BE CONSIDERED
|
SECTION
|
SUBCLAUSE AND REASON UNDER THE ACT
|
PUBLIC INTEREST CONSIDERATION
|
Potential Release Review Date and
Conditions
|
|
15.
|
Visibility of Capital Project Changes: October 2025
|
s7(2)(h)
|
Commercial Activities
|
The report contains information on specific projects being
tendered in the open market and the commercial sensitivity of the information
means that it must remain confidential in order to protect the Council's
commercial position, and withholding the information at this time is
reasonable and outweighs the public interest.
|
25 November 2027
This report can be released to the public once all commercial
negotiations and contracts have been concluded, and subject to the approval
of the Head of Procurement and Contracts.
|
Karakia Whakamutunga
Kia whakairia te tapu
Kia wātea ai te ara
Kia turuki whakataha ai
Kia turuki whakataha ai
Haumi e. Hui e. Tāiki e
Actions Register Ngā Mahinga
When decisions are made at meetings, these
are assigned to staff as actions to implement. The following lists
detail any actions from this meeting that were:
·
Open at the time the agenda was generated.
·
Closed since the last ordinary meeting agenda
was generated.
Open Actions Ngā Mahinga Tuwhera
No open actions were remaining at the time
the agenda was generated.
Actions Closed Since the Last Meeting Ngā
Mahinga kua Tutuki nō Tērā Hui
No actions were
closed since the last ordinary meeting.